Modern IT systems are increasingly complex, with a blend of on-premises and hybrid cloud infrastructure, microservices, distributed applications, and more. The huge volume of data generated by monitoring an organization's infrastructure makes it challenging to analyze the data manually and make meaningful conclusions. And for any business, time is money. This is why businesses need anobservability tool for full-stack IT visibility. An observability tool helps teams navigate this complexity by surveilling the IT environment to avoid network anomalies, predicting changes, and forecasting issues in advance.
Observability tools have extensive predictive capabilities that enhance an organization's capability to ensure a proactive and data-driven approach to IT management. While prediction and forecasting are valuable tactics in network monitoring, they have limitations that make them insufficient by themselves for future-proofing the network management process. Here's an example:
Imagine a rapidly expanding e-commerce company that operates a large online marketplace. The business deals with huge volumes of user traffic, product listings, and customer data. As the volume of transactions and website activity grows, the company’s data storage demands increase, putting pressure on its network infrastructure, including disk space.
During a major sales event, such as Black Friday or Cyber Monday, the website sees a surge in customer activity, leading to a rapid accumulation of order histories, customer reviews, and updated product catalogs. The company's smart network monitoring tool forecasts that the disk utilization is about to increase by 20%, and that the disk will run out of space in about four days.
The forecast and prediction by itself has merit in alerting the business about the potential issue. But it does not portray the effect this issue can have—the consequences of it being ignored. If the company’s storage resources are not dynamically managed, they risk running out of disk space during the event, potentially causing website slowdowns, incomplete transactions, or system failures. This is not ideal for the business.
OpManager's option for predictive observability is the Zia Insights Dashboard, a powerful tool for forecast recommendations. Forecast recommendations go beyond simple predictions by providing actionable guidance to network administrators. This is critical for effective and proactive network management, especially when dealing with complex and dynamic environments like large enterprise networks.
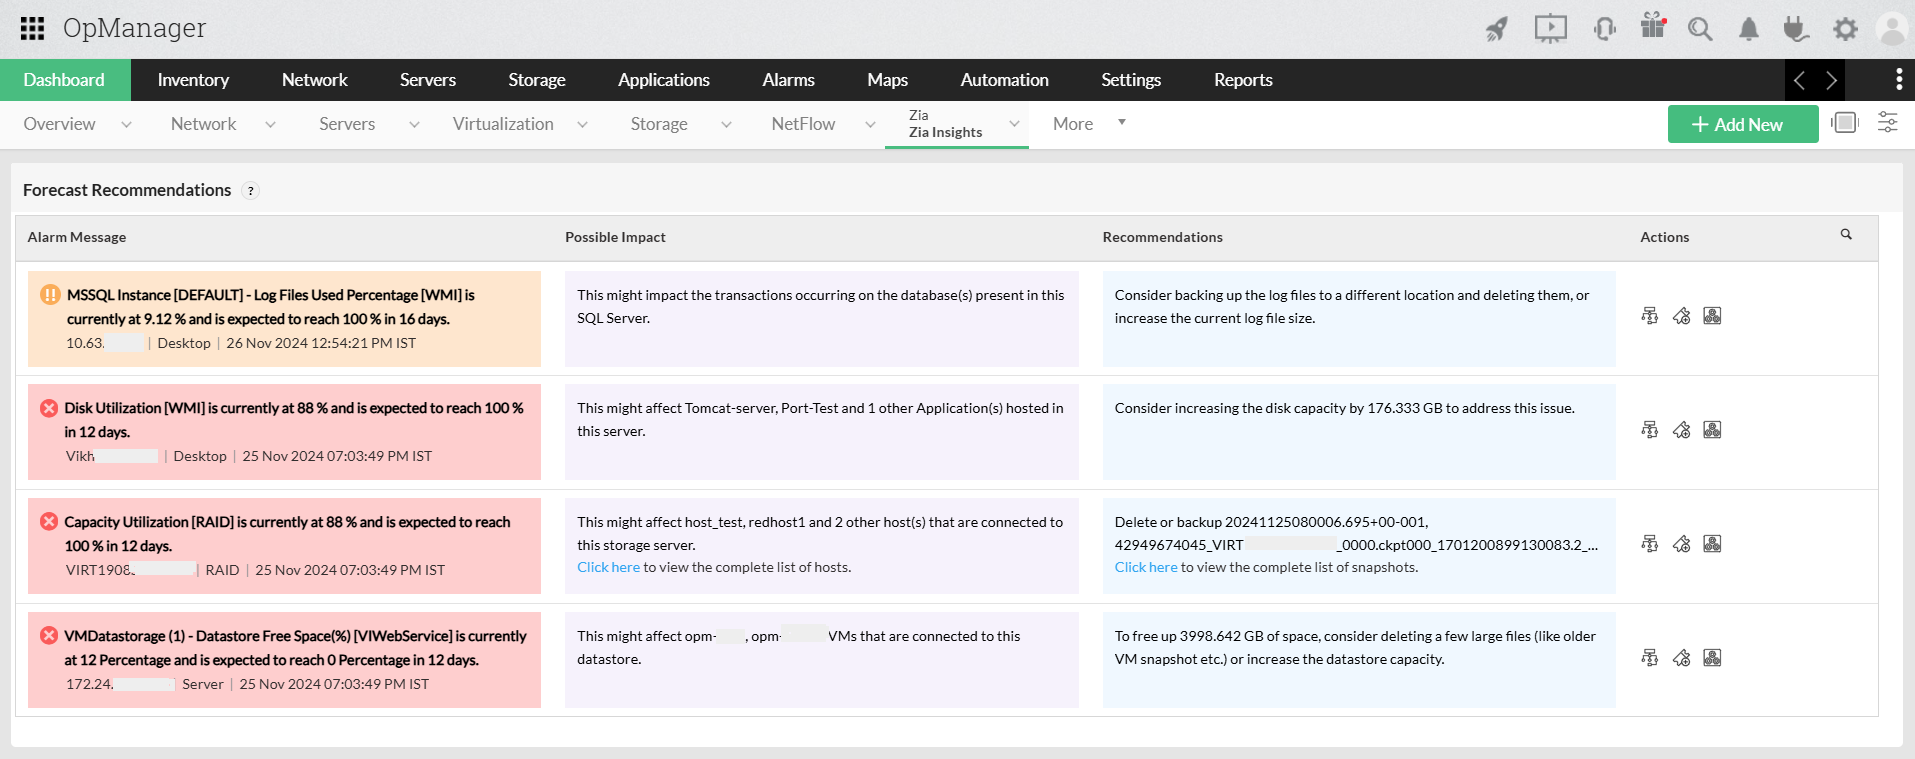
The powerhouse of the forecast recommendations provided by Zia Insights Dashboard is forecast alerts. Forecast Alerts help you stay updated on the resource utilization of your network devices by predicting approximately how long it will take for each of your resources to be exhausted. OpManager uses the data from the Forecast Alerts to identify what else could go wrong and what other resources could be affected if each Forecast Alert is not addressed, and what the user can do to avoid this.
Example: If disk usage is forecasted to reach 90% within a week, the recommendation might be to add another 500GB of storage, to run an automated cleanup script to free up space by deleting old logs, or to transfer infrequently accessed data to archive storage.


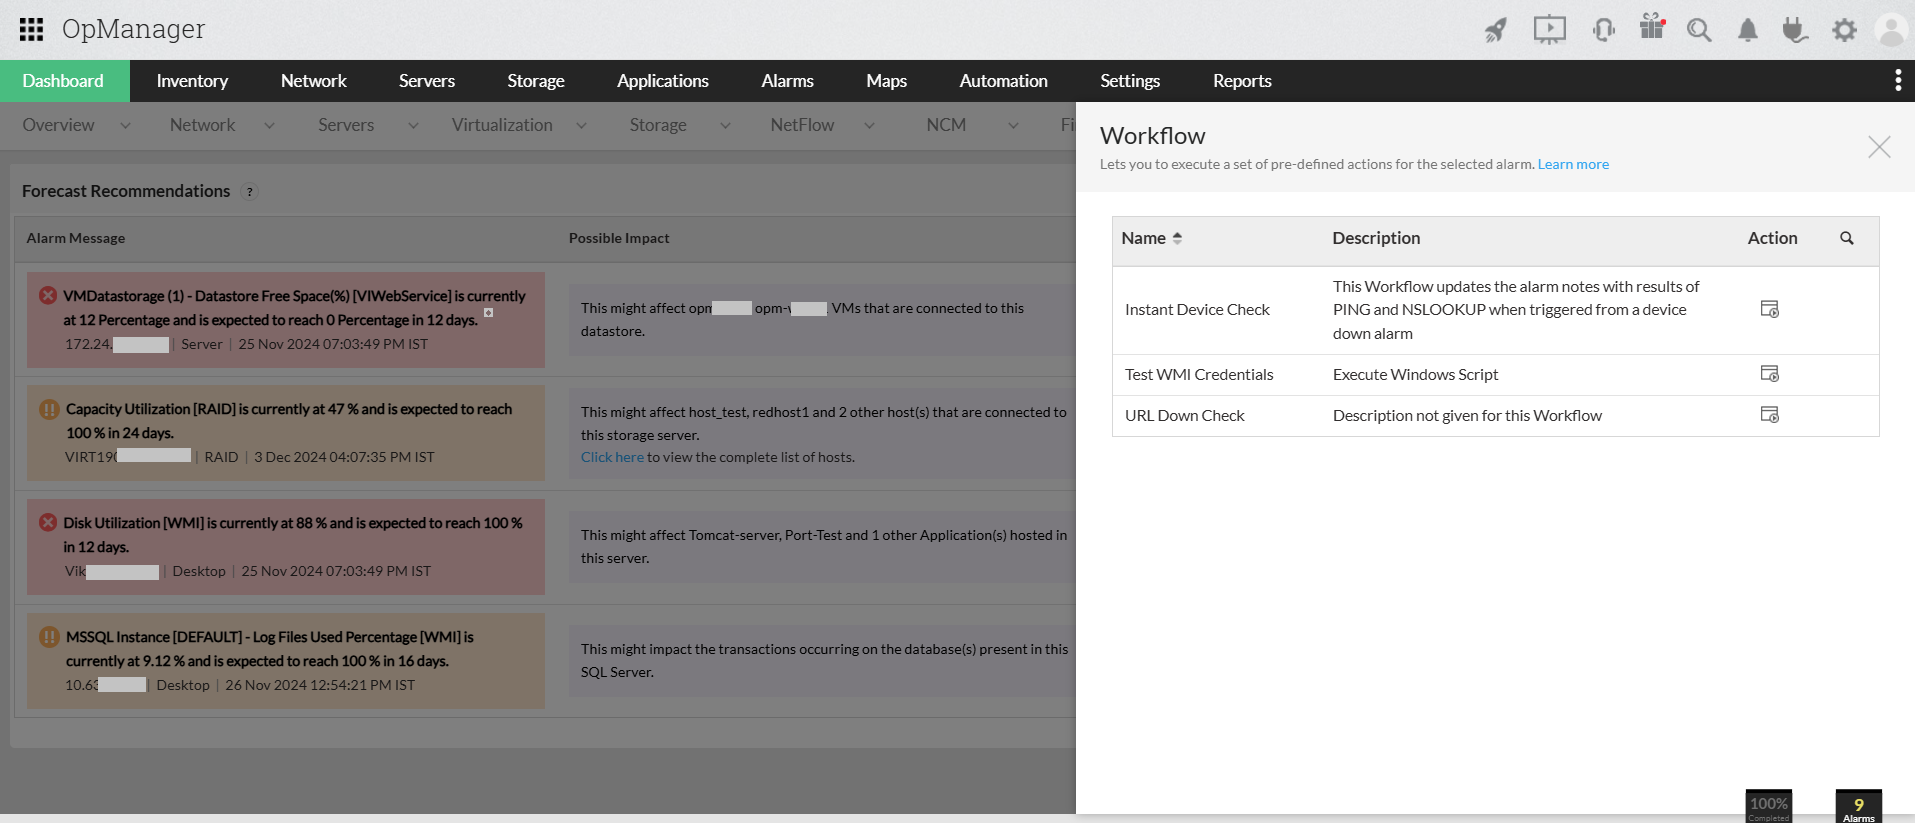
Based on the identified issue and the predicted extent of resource outage, the admin can choose to perform a few actions:

Prediction and forecasting are essential tools for understanding and anticipating future network behaviors, but they alone cannot ensure the network remains healthy and optimized. Zia Dashboard's forecast recommendations provide the actionable insights and guidance required for responding to forecasted events—ensuring timely interventions and optimizing resource allocation—making them a crucial part of proactive network management. They empower network admins to not only see potential issues coming but also take decisive, effective actions to prevent them, ensuring smooth and reliable network performance. The benefits of this dashboard have been summarized here:
Interested in learning more? Download ManageEngine OpManager or check our free, 30-day trial to see OpManager's Forecast Alerts and Zia Insights Dashboard in action. Want more features? Request them here. Meanwhile, subscribe to our monthly newsletter to keep up with our latest releases and updates.
1. How does the Zia Insights dashboard display recommendations?
It analyzes network data, detects trends, and provides actionable insights or suggestions.
2. Is the Zia Insights dashboard available in the Standard edition?
No, this is a premium feature and is available only in the Professional and Enterprise editions.
3. How do I disable recommendations in the Zia Insights dashboard?
Go to the Forecast Alerts configuration page and disable the toggle for the whole dashboard or specific monitors.
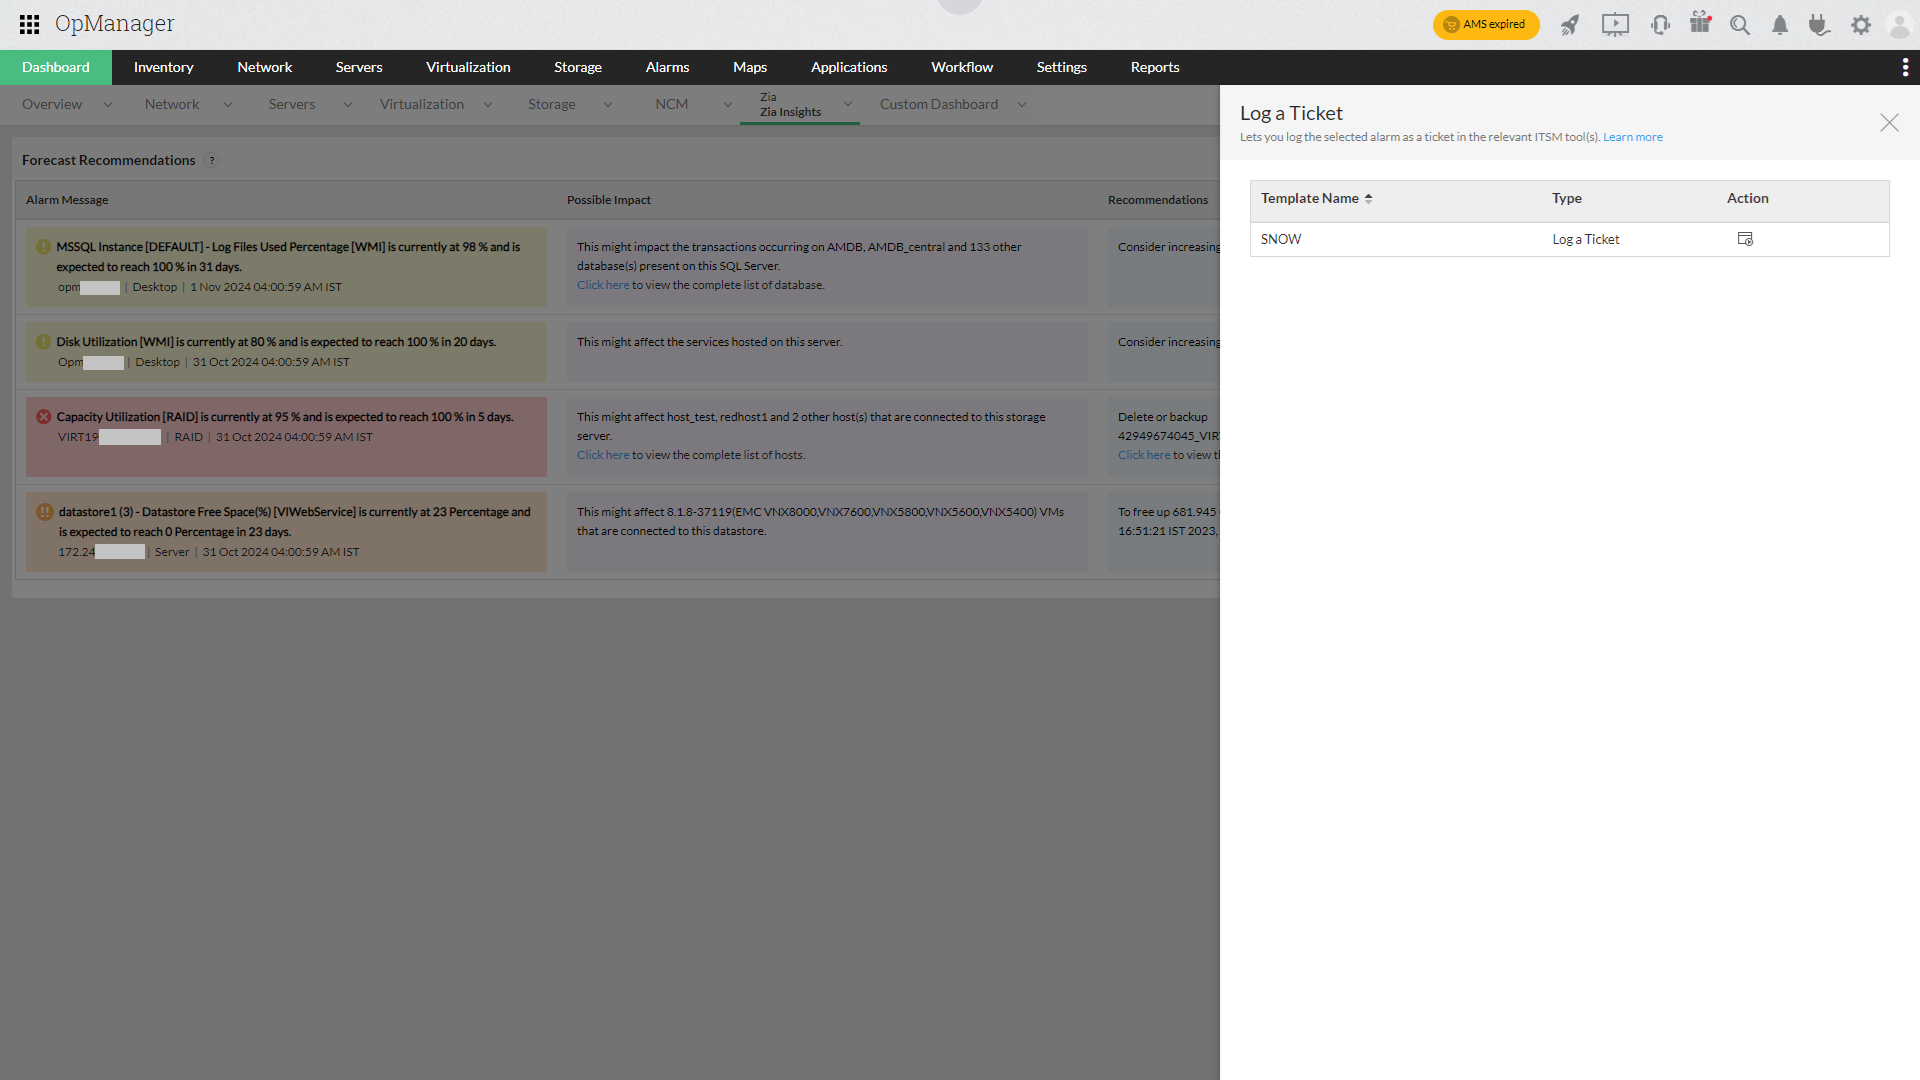
4. What actions can I take based on recommendations shown in the Zia Insights dashboard?
You can configure a predefined workflow to be executed for specific types of alerts or log a ticket for the respective team to address resource exhaustion.
5. What is Impact and how is it calculated in the Zia Insights dashboard?
Based on device data—such as performance metrics and application metrics—Zia attempts to calculate the potential impact that might occur.
6. I want recommendations to be shown only for a few Forecast Rules. How can I configure them?
Go to the Forecast Alerts configuration page and disable the toggle for the specific rules for which alerts are not required.