The main challenges for businesses today are managing IT infrastructure at scale, being able to match resources to application requirements, and managing all of the different types of infrastructure in a simple, holistic fashion. The straightforward solution to these challenges is Cisco Unified Computing System (UCS). Cisco UCS is converged data center architecture that integrates computing, networking, and storage resources to increase efficiency and enable centralized management. The goal of Cisco UCS is to simplify the number of devices that need to be connected, configured, cooled, and secured and provide admins with the ability to manage everything through a single interface.
Even though Cisco servers are equipped with high-quality devices, no one can guarantee no failure will occur. Hardware issues are generally related to disk drives, RAIDs, and power supplies. A problem in a critical device such as a processor could cause a server to fail or run slowly, or lead to data loss or corruption. IT admins should carefully monitor the physical health of their servers. As IT admins do not have time to check individual servers every day, they need a solution that will enable them to monitor all their Cisco environments from a single point to predict issues, correct them more quickly, or take preventive actions.
Even though IT administrators plan to harmonize their data center, the servers in unified computing systems can still be mixed. This heterogeneous environment complicates hardware monitoring, highlighting the need for a hybrid monitoring tool to monitor multi-vendor hardware devices.
ManageEngine OpManager, with its Cisco network monitoring and UCS monitoring capabilities, helps ensure your Cisco UCS environment and its critical components are always up and running by monitoring key performance metrics. OpManager collects real-time data on Cisco UCS and monitors critical performance metrics, including resource utilization, response time, CPU load, network latency, and packet loss, via the Cisco UCS Manager API.
OpManager's easy-to-understand dashboards give a detailed view of the health and performance status of UCS's server hardware and proactively notifies you about failures in critical server components, such as the UCS chassis, blade, CPU, battery, fan speed, temperature, and power supply.
The Cisco UCS monitor from OpManager enables you to:
Monitor Cisco UCS server health and availability proactively with OpManager's threshold-based monitoring. OpManager helps you track key performance metrics to ensure both the server and its hardware components are in good health and operation. The dashboard view consolidates all the monitoring data into graphical representations and tables that help you gain a glimpse of your network. With the support of over 535 vendors, you can extend monitoring to any native or custom application.
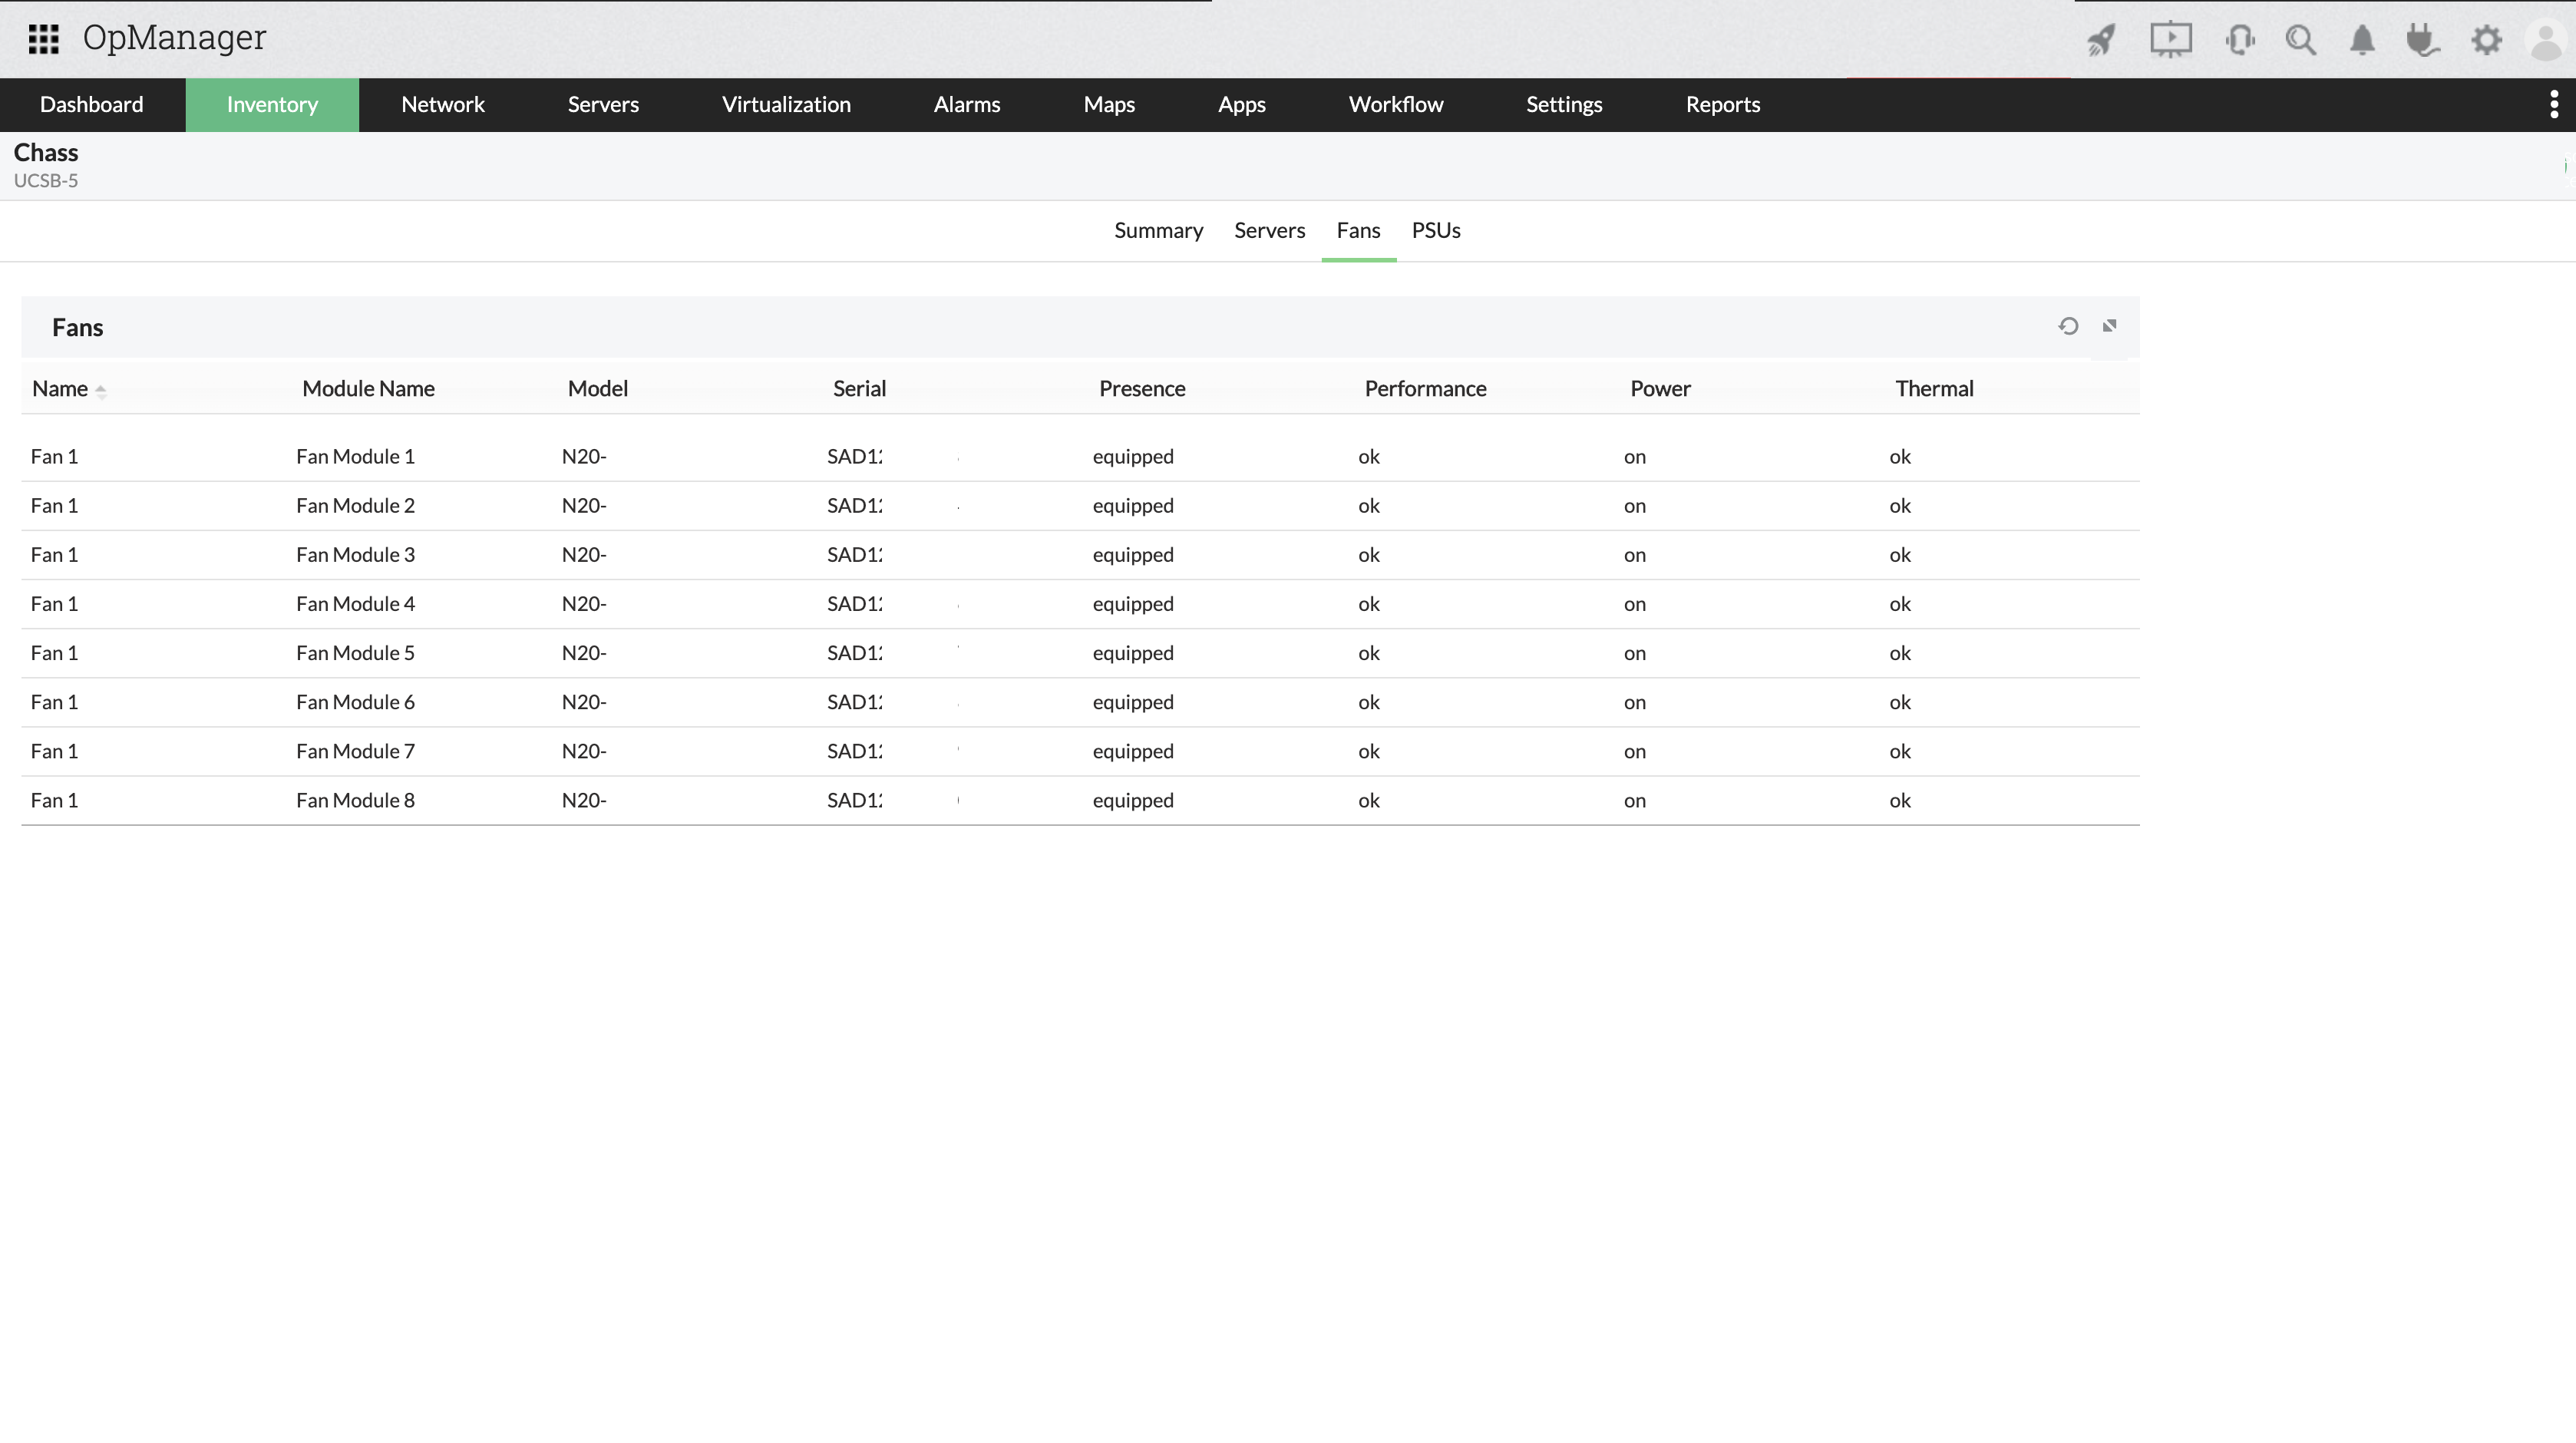
OpManager's Cisco UCS monitor scrutinizes Cisco chassis and the servers, memory modules, and fabric extenders present in the chassis. OpManager monitors each fan and temperature sensor to help guarantee your blades are properly cooled. OpManager also indicates overall power consumption, which is critical information in many data centers as power optimization can be a key issue.
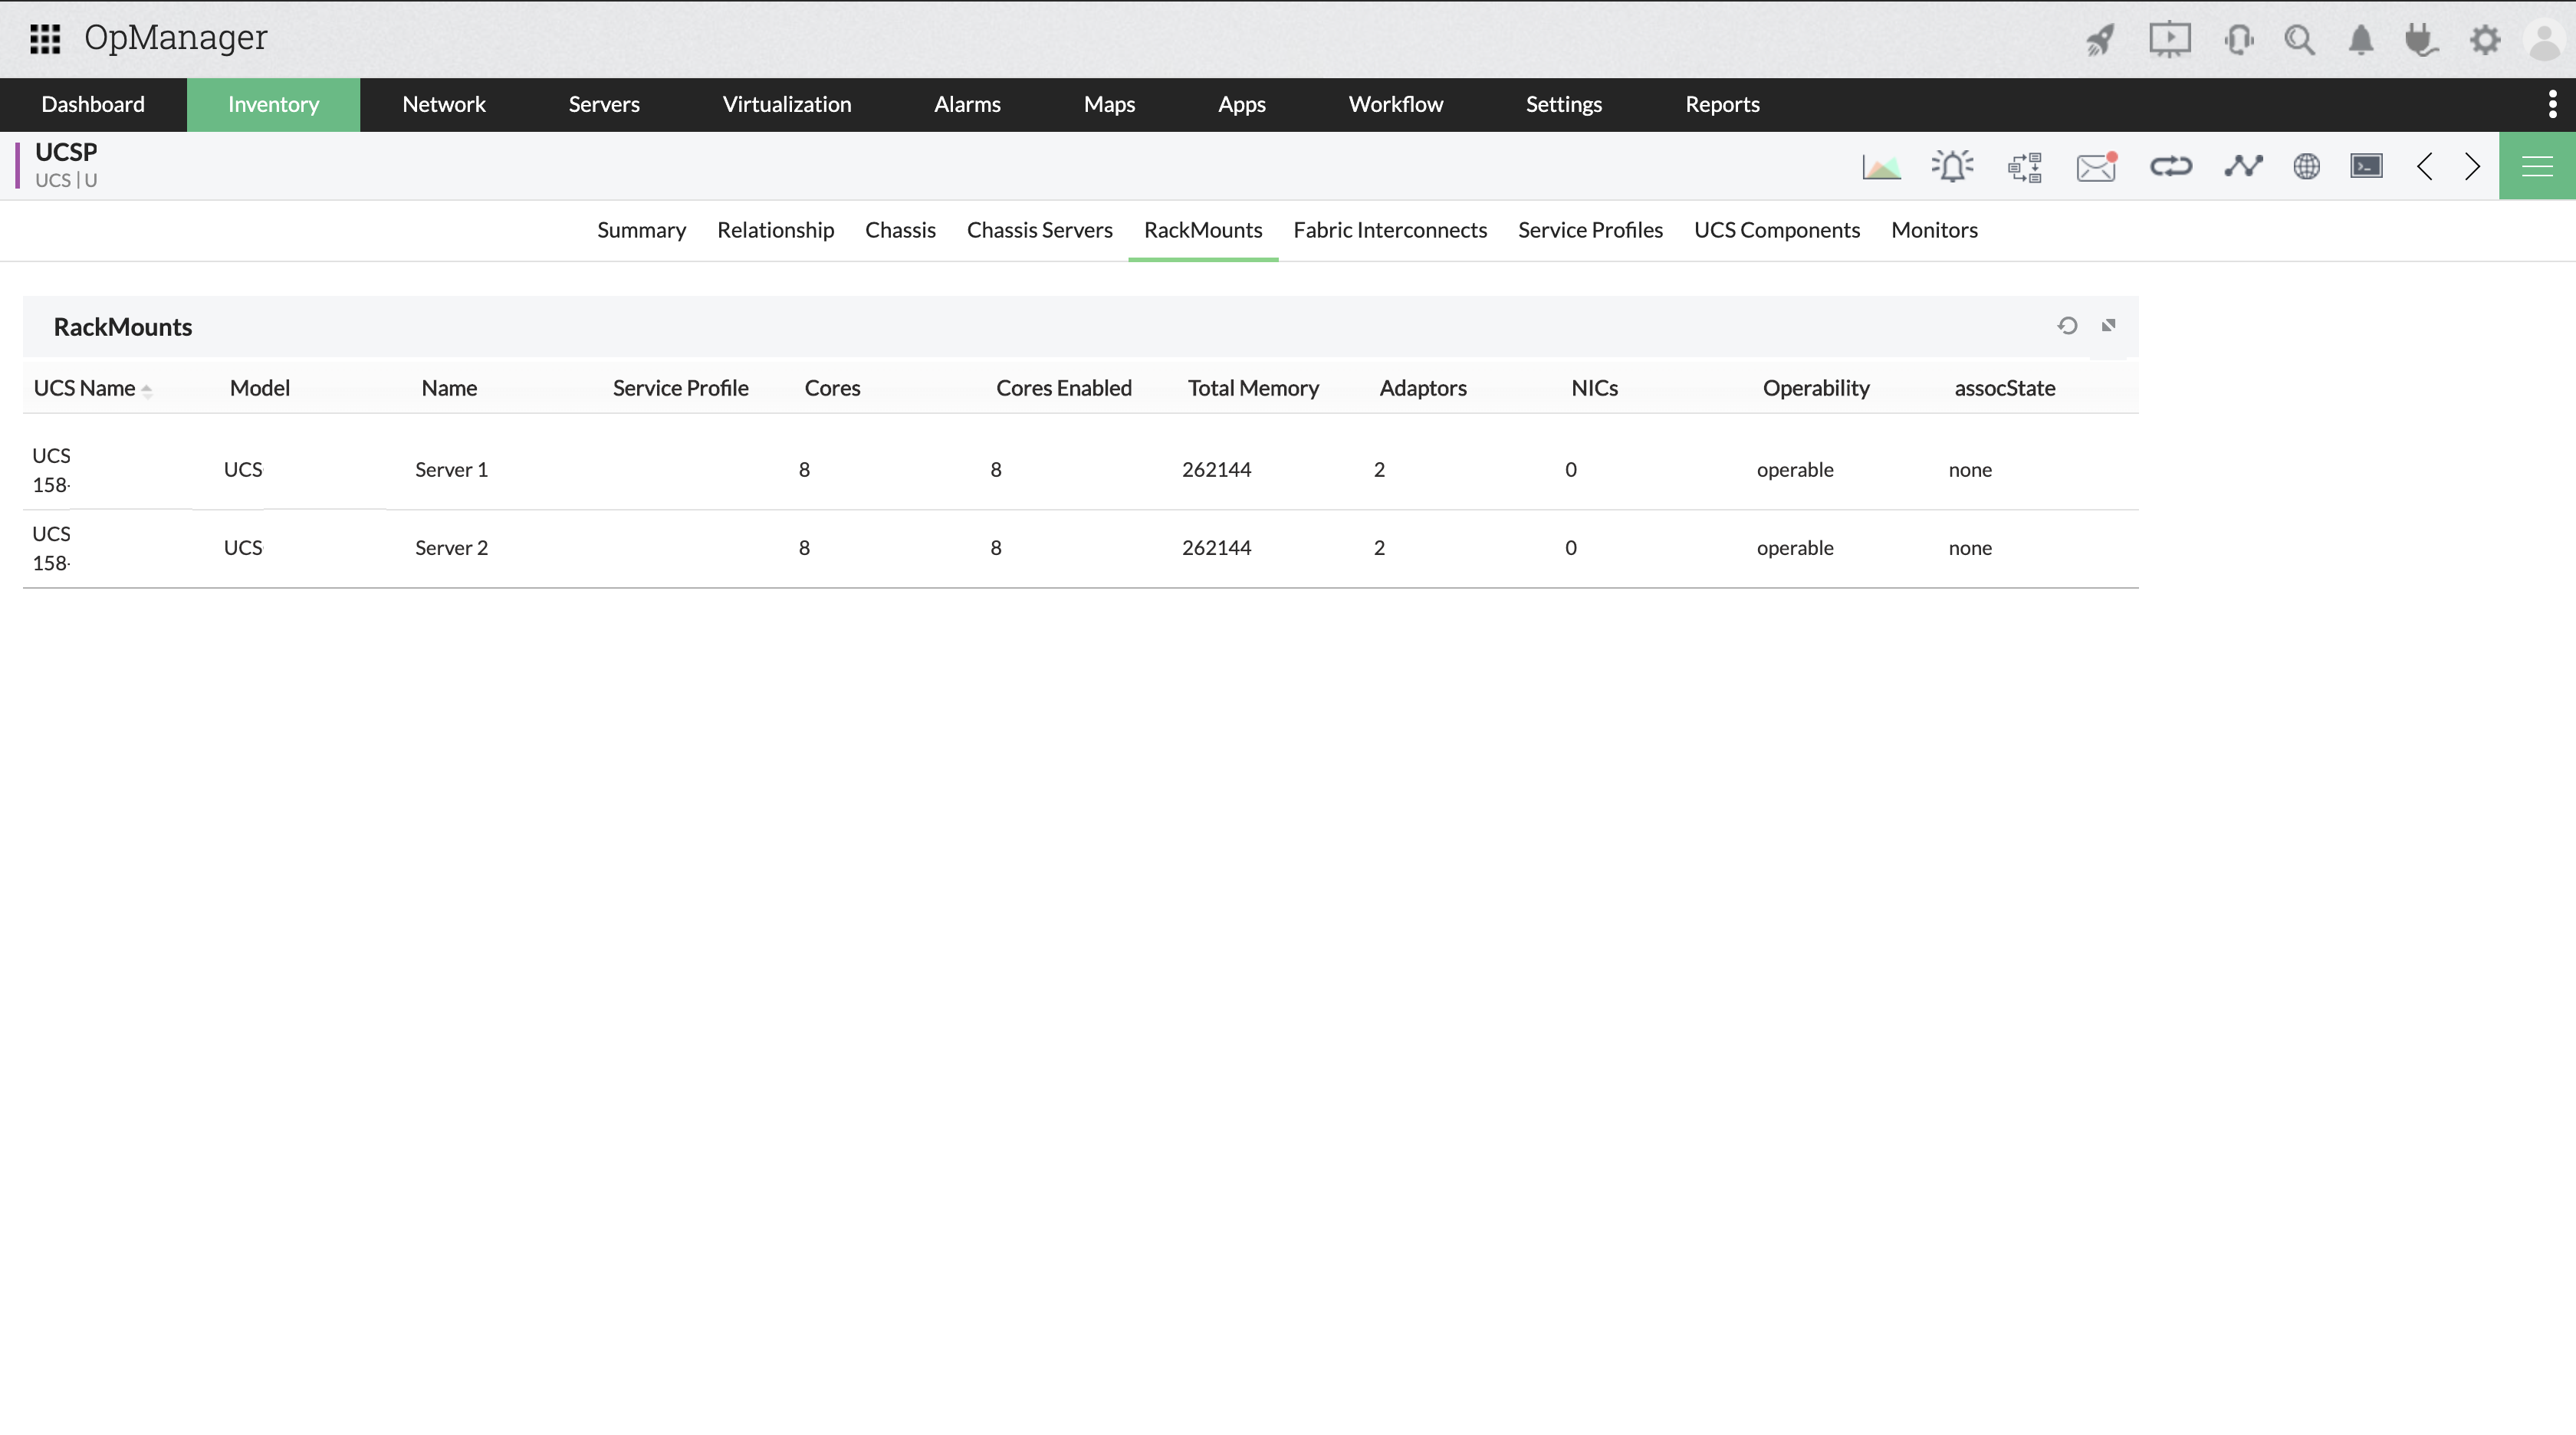
Cisco's rack mounts are extensive, with several processors, memory modules, and drive units. Among the devices available, processors and memory modules can be considered the most critical. In fact, a processor fault will lead to a system reboot. You need to know if each processor is actually operational and running; as soon as a processor has been disabled upon a reboot, you must be notified. Likewise, it is important to monitor memory modules since a single error in the main memory can lead to a severe computer crash, potentially causing data corruption.
By monitoring the memory modules, you’ll have precise statistics on failures, be informed when a failure is predicted, and be able to take precautionary measures. With OpManager's Cisco UCS performance monitoring, thoroughly track critical metrics related to the memory, CPU, and motherboard in the rack mounts and ensure optimal performance.
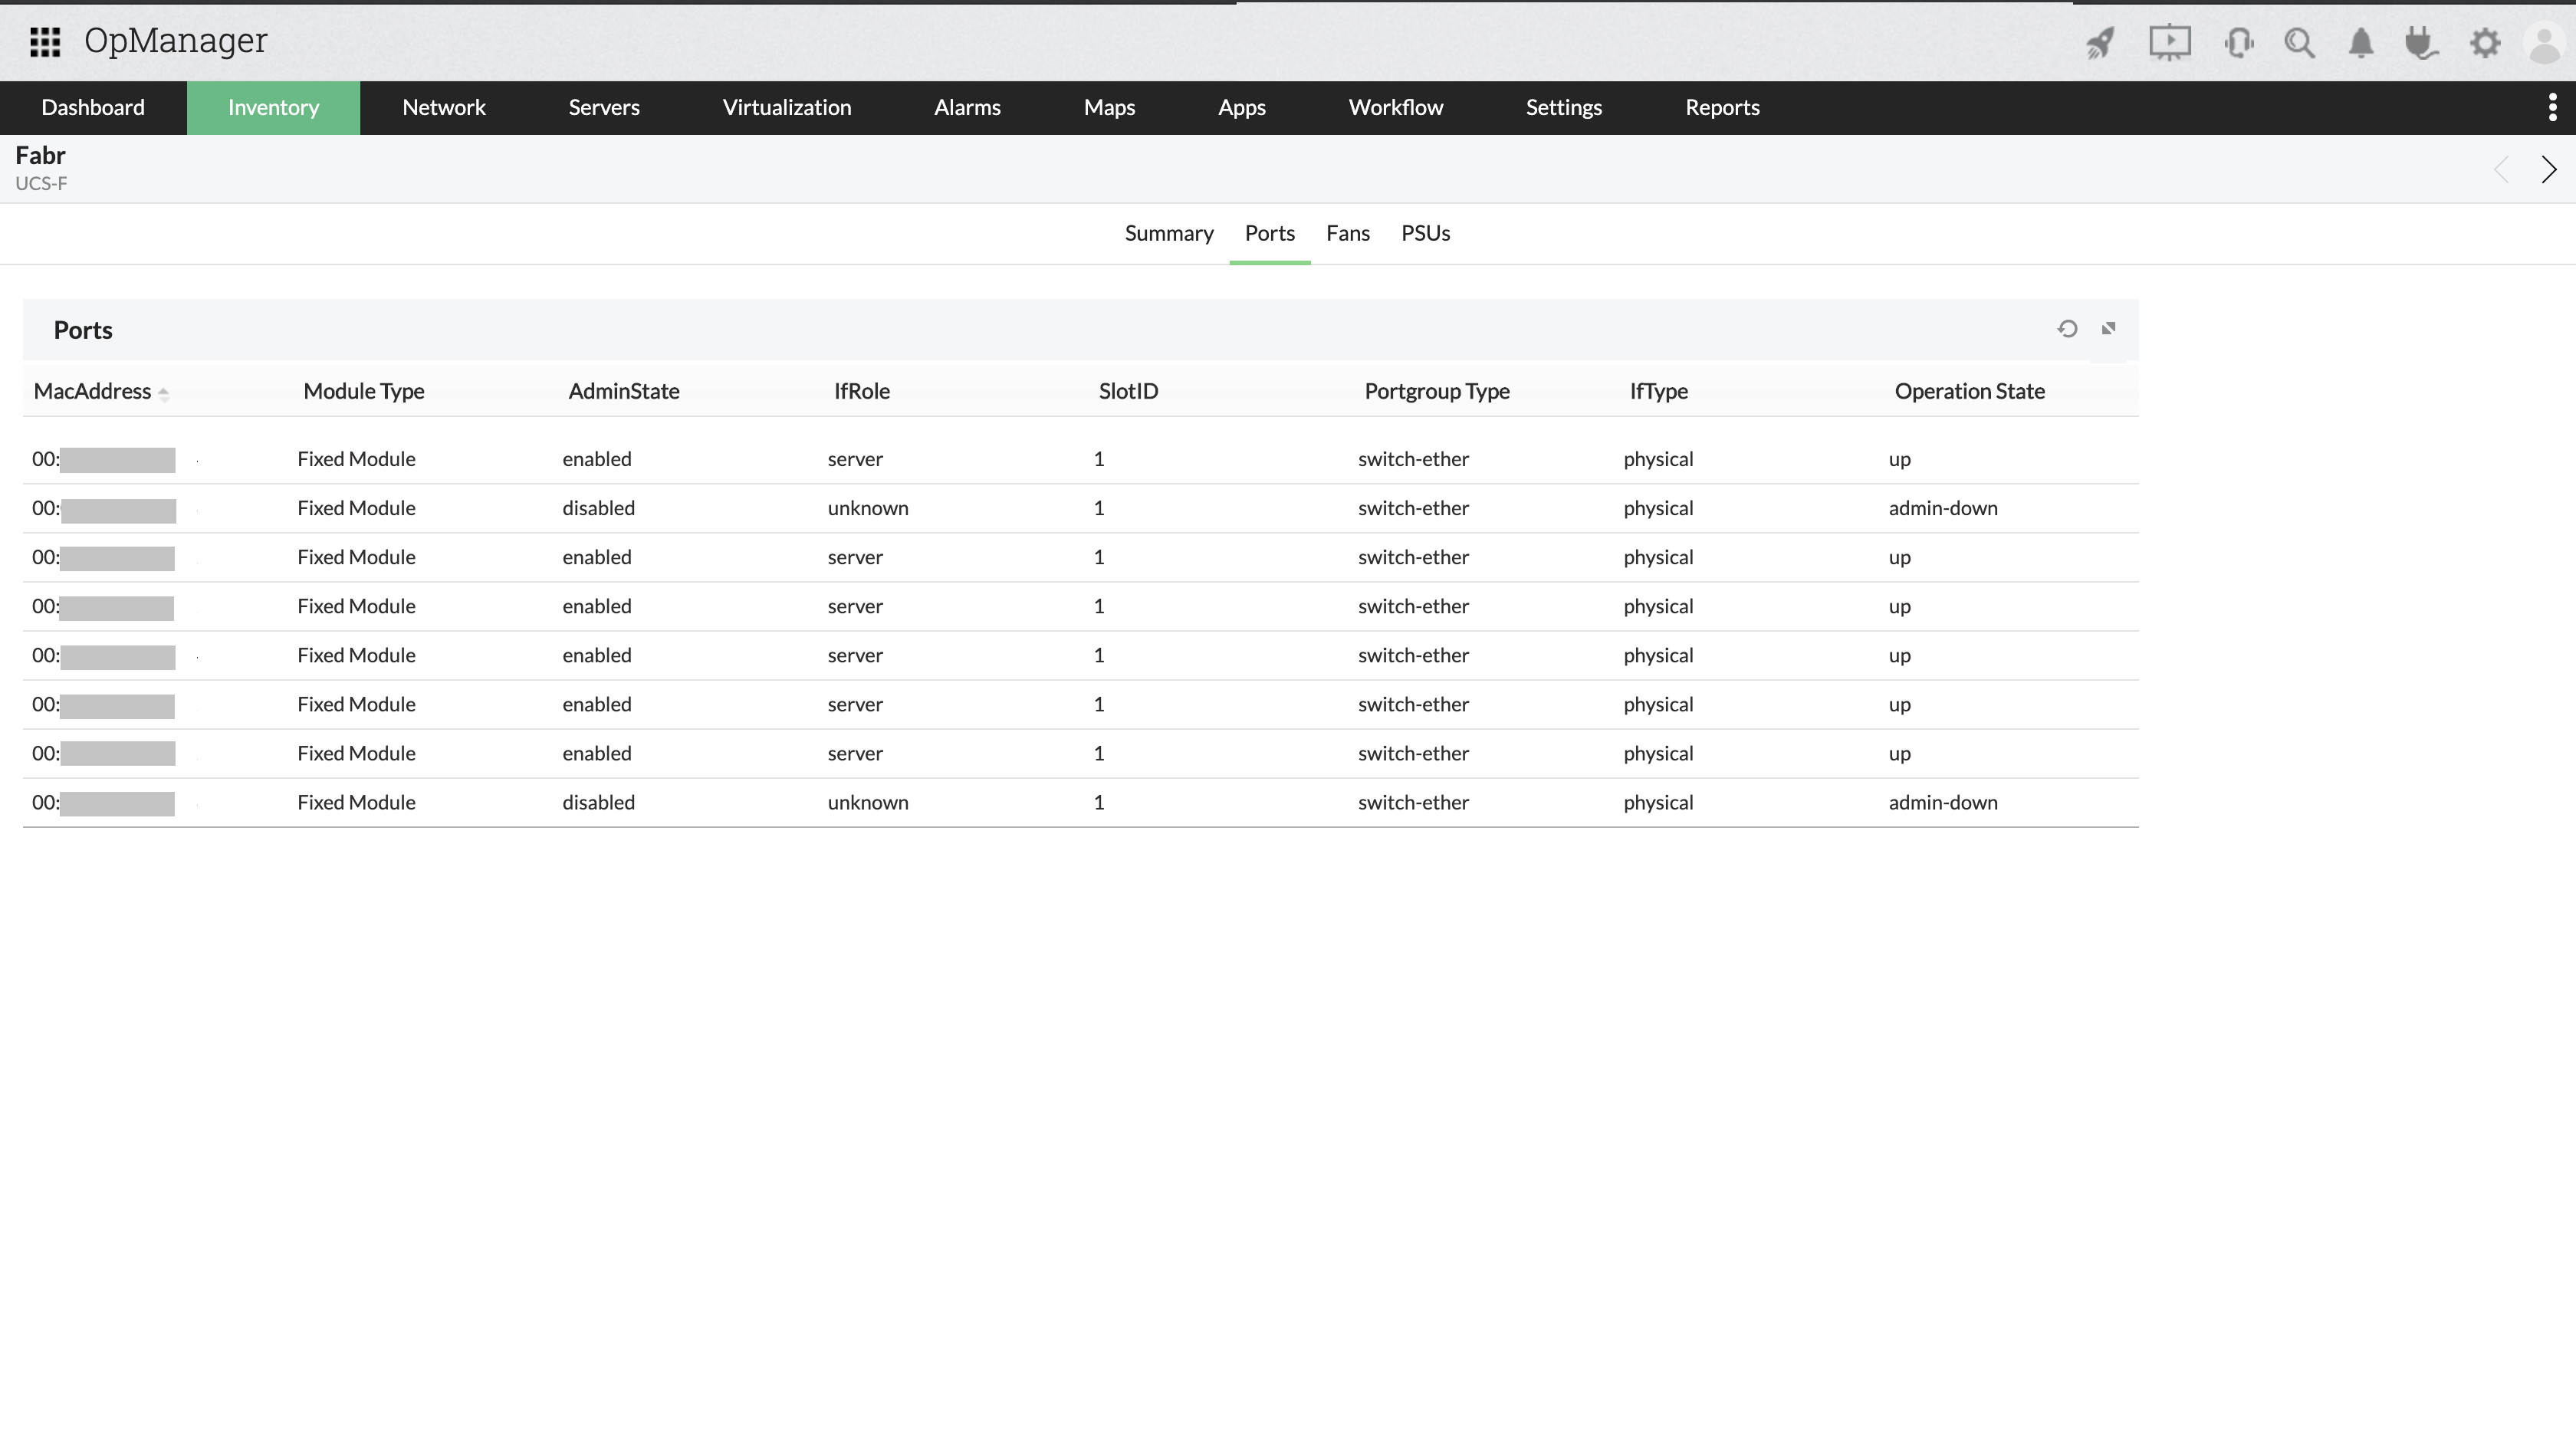
Cisco UCS Fabric Interconnect exists to connect Cisco UCS servers to the network. UCS Manager also runs on Fabric Interconnect. Monitoring Fabric Interconnect will increase network reliability and help reduce the costs associated with downtime. OpManager's Cisco UCS monitoring tool provides details about the memory used, power consumed, input current and voltage, and fabric extenders.
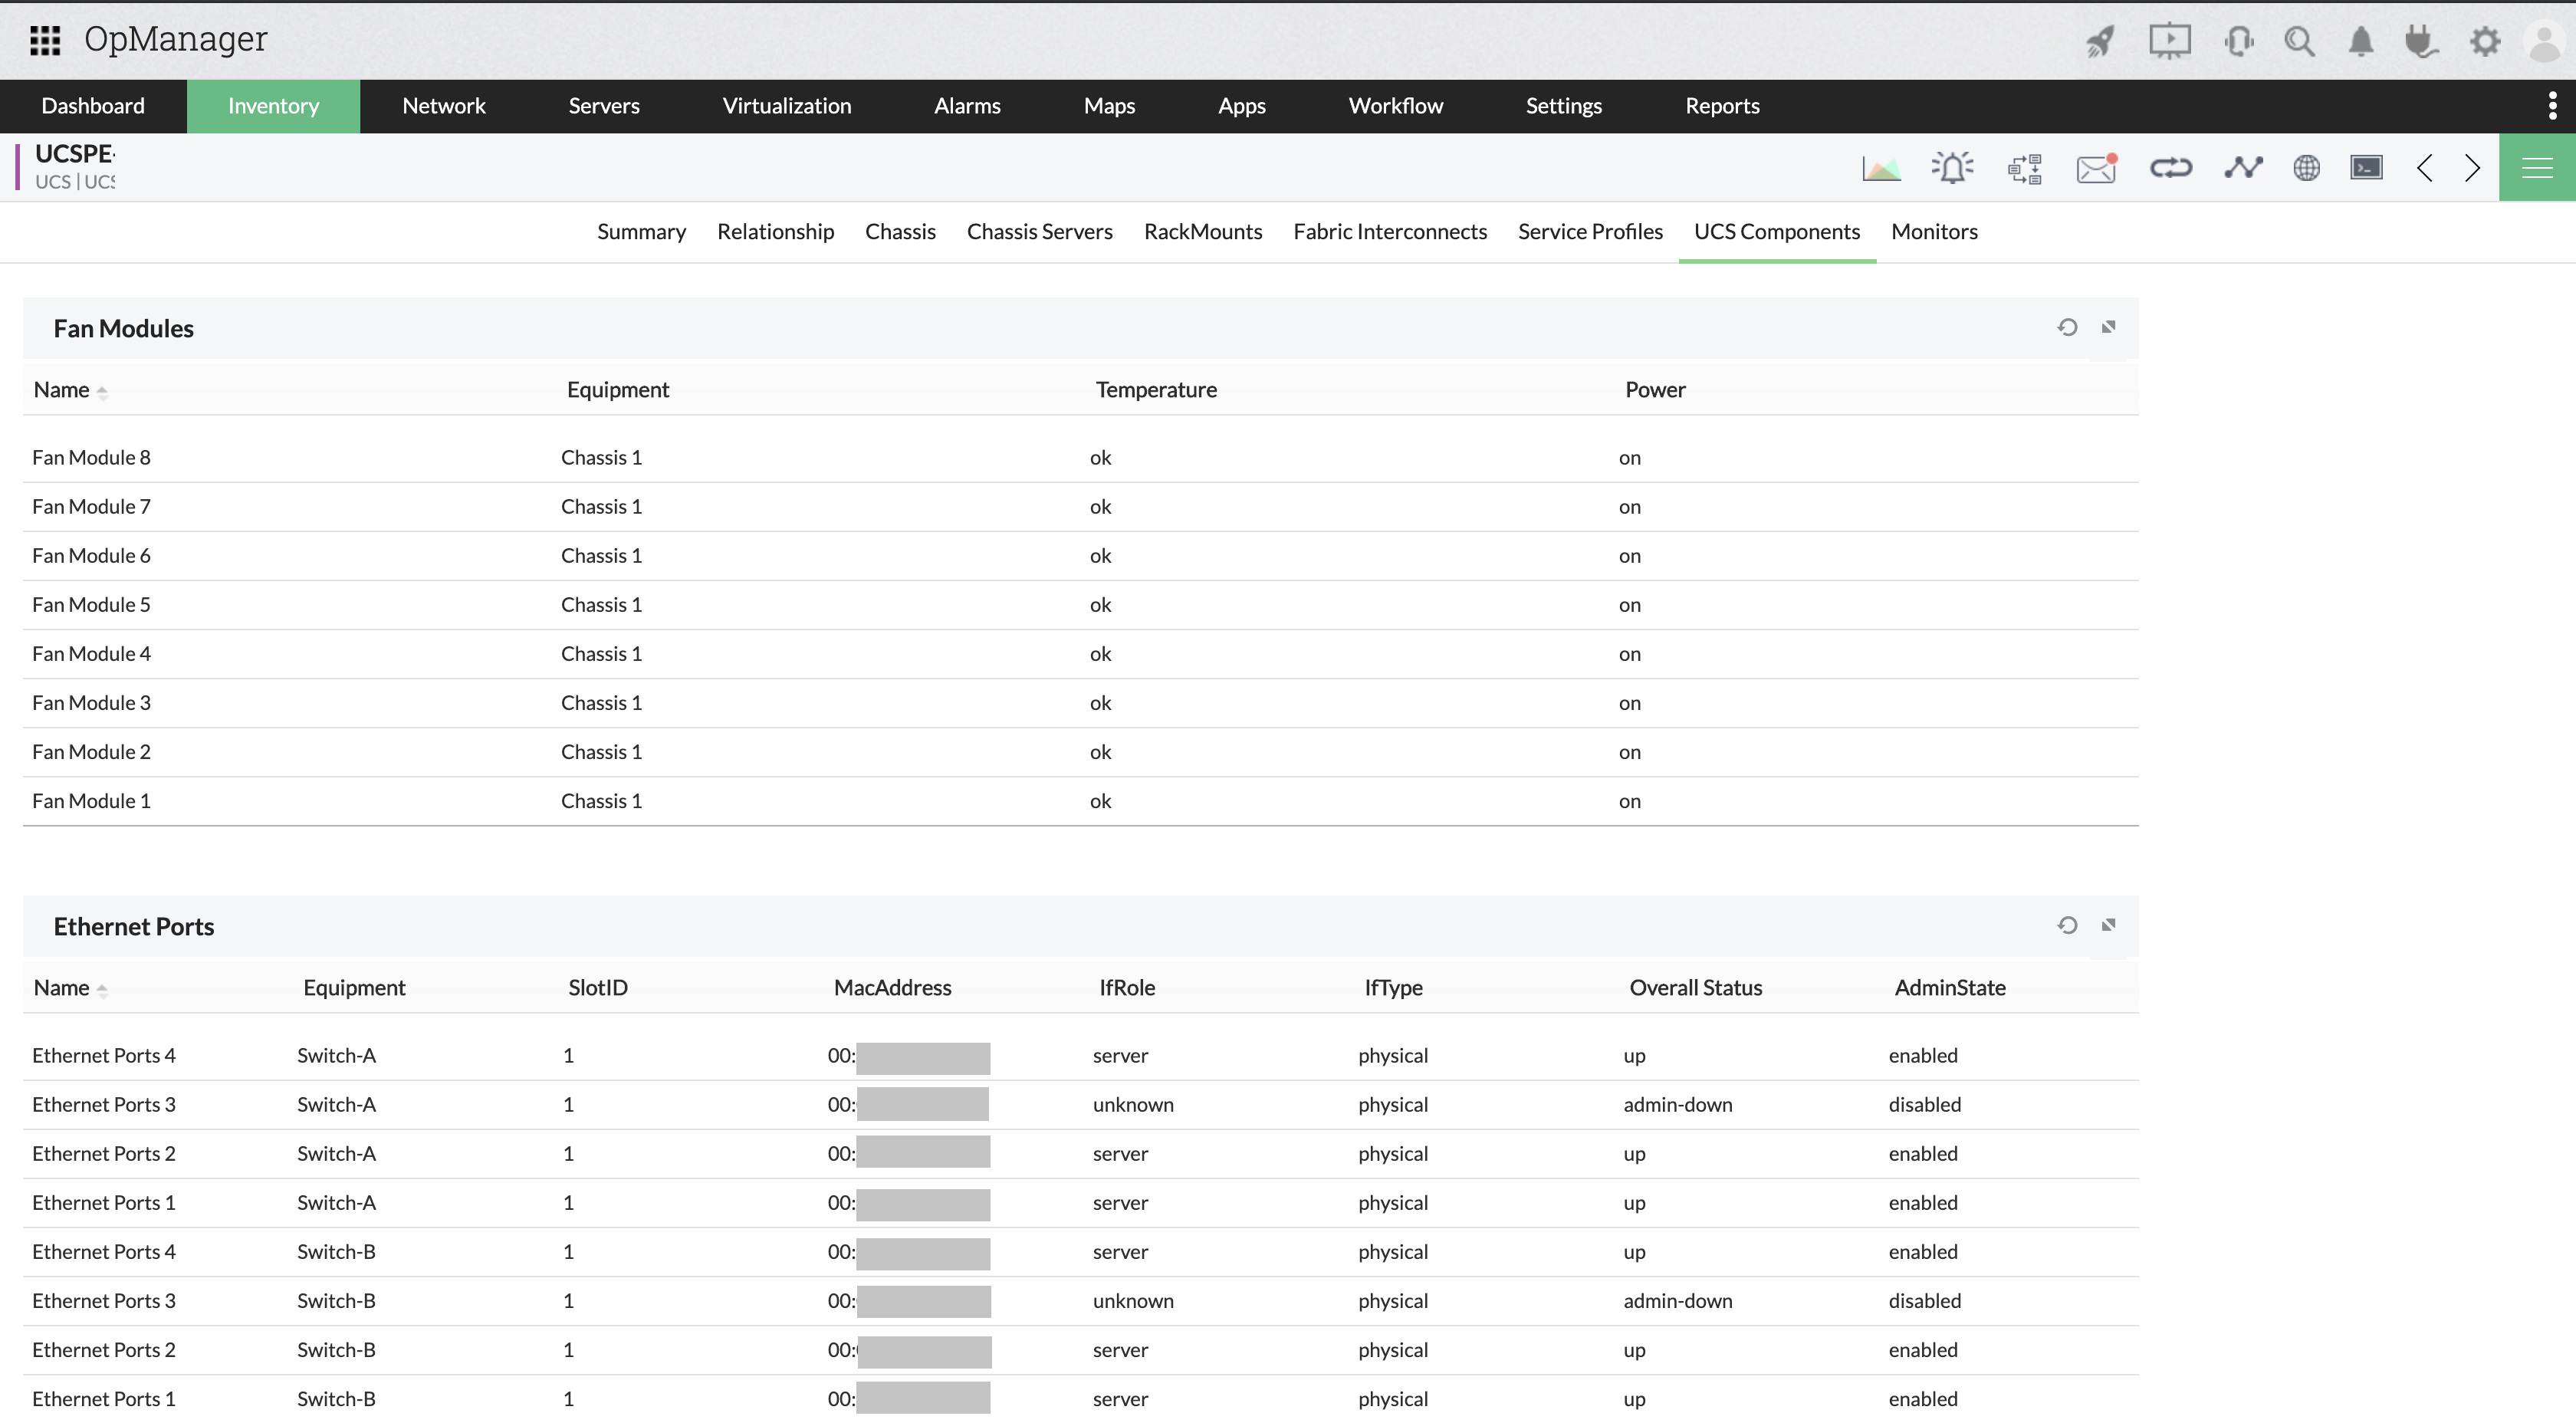
UCS has other critical components, like fan modules, ethernet ports, I/O modules, fabric extenders, and adaptor units. These components are also monitored by OpManager's Cisco UCS monitor to ensure that they are healthy and operating at optimum performance levels.
When a fault is detected in your Cisco UCS environment, an event occurs; multiple correlated events trigger an alarm. OpManager's UCS monitoring performs intelligent event processing. It correlates raw network events, filters unwanted events, and presents only meaningful alarms. OpManager supports color-coded alarms which are presented in a user-friendly format. You can also view the event history associated with an alarm and manually clear or delete alarms.
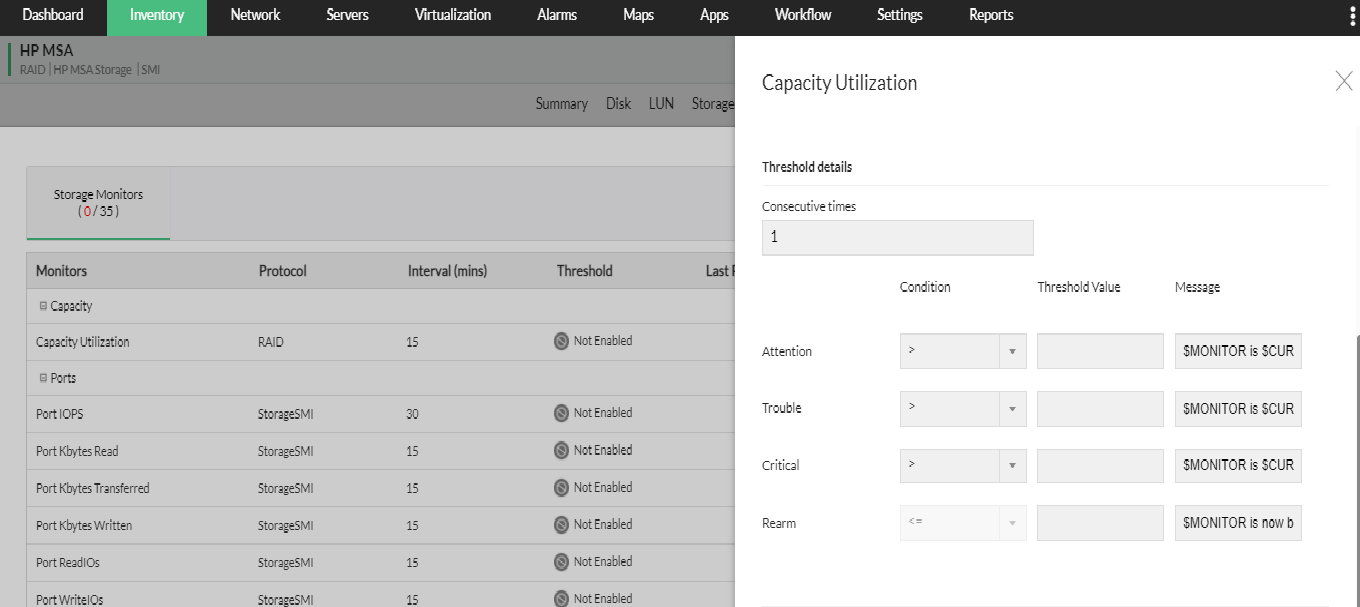
OpManager's alerting mechanism can notify you through SMS and/or email whenever an alarm occurs. OpManager supports various alert mechanisms and can alert you when a device or service goes down. You can specify the threshold rules for a service, application, or device and can have OpManager alert you when the threshold rule is violated. You can add more intelligence to threshold configurations by specifying the number of violations allowed before actually triggering an alert. OpManager allows you to configure thresholds in bulk, too.
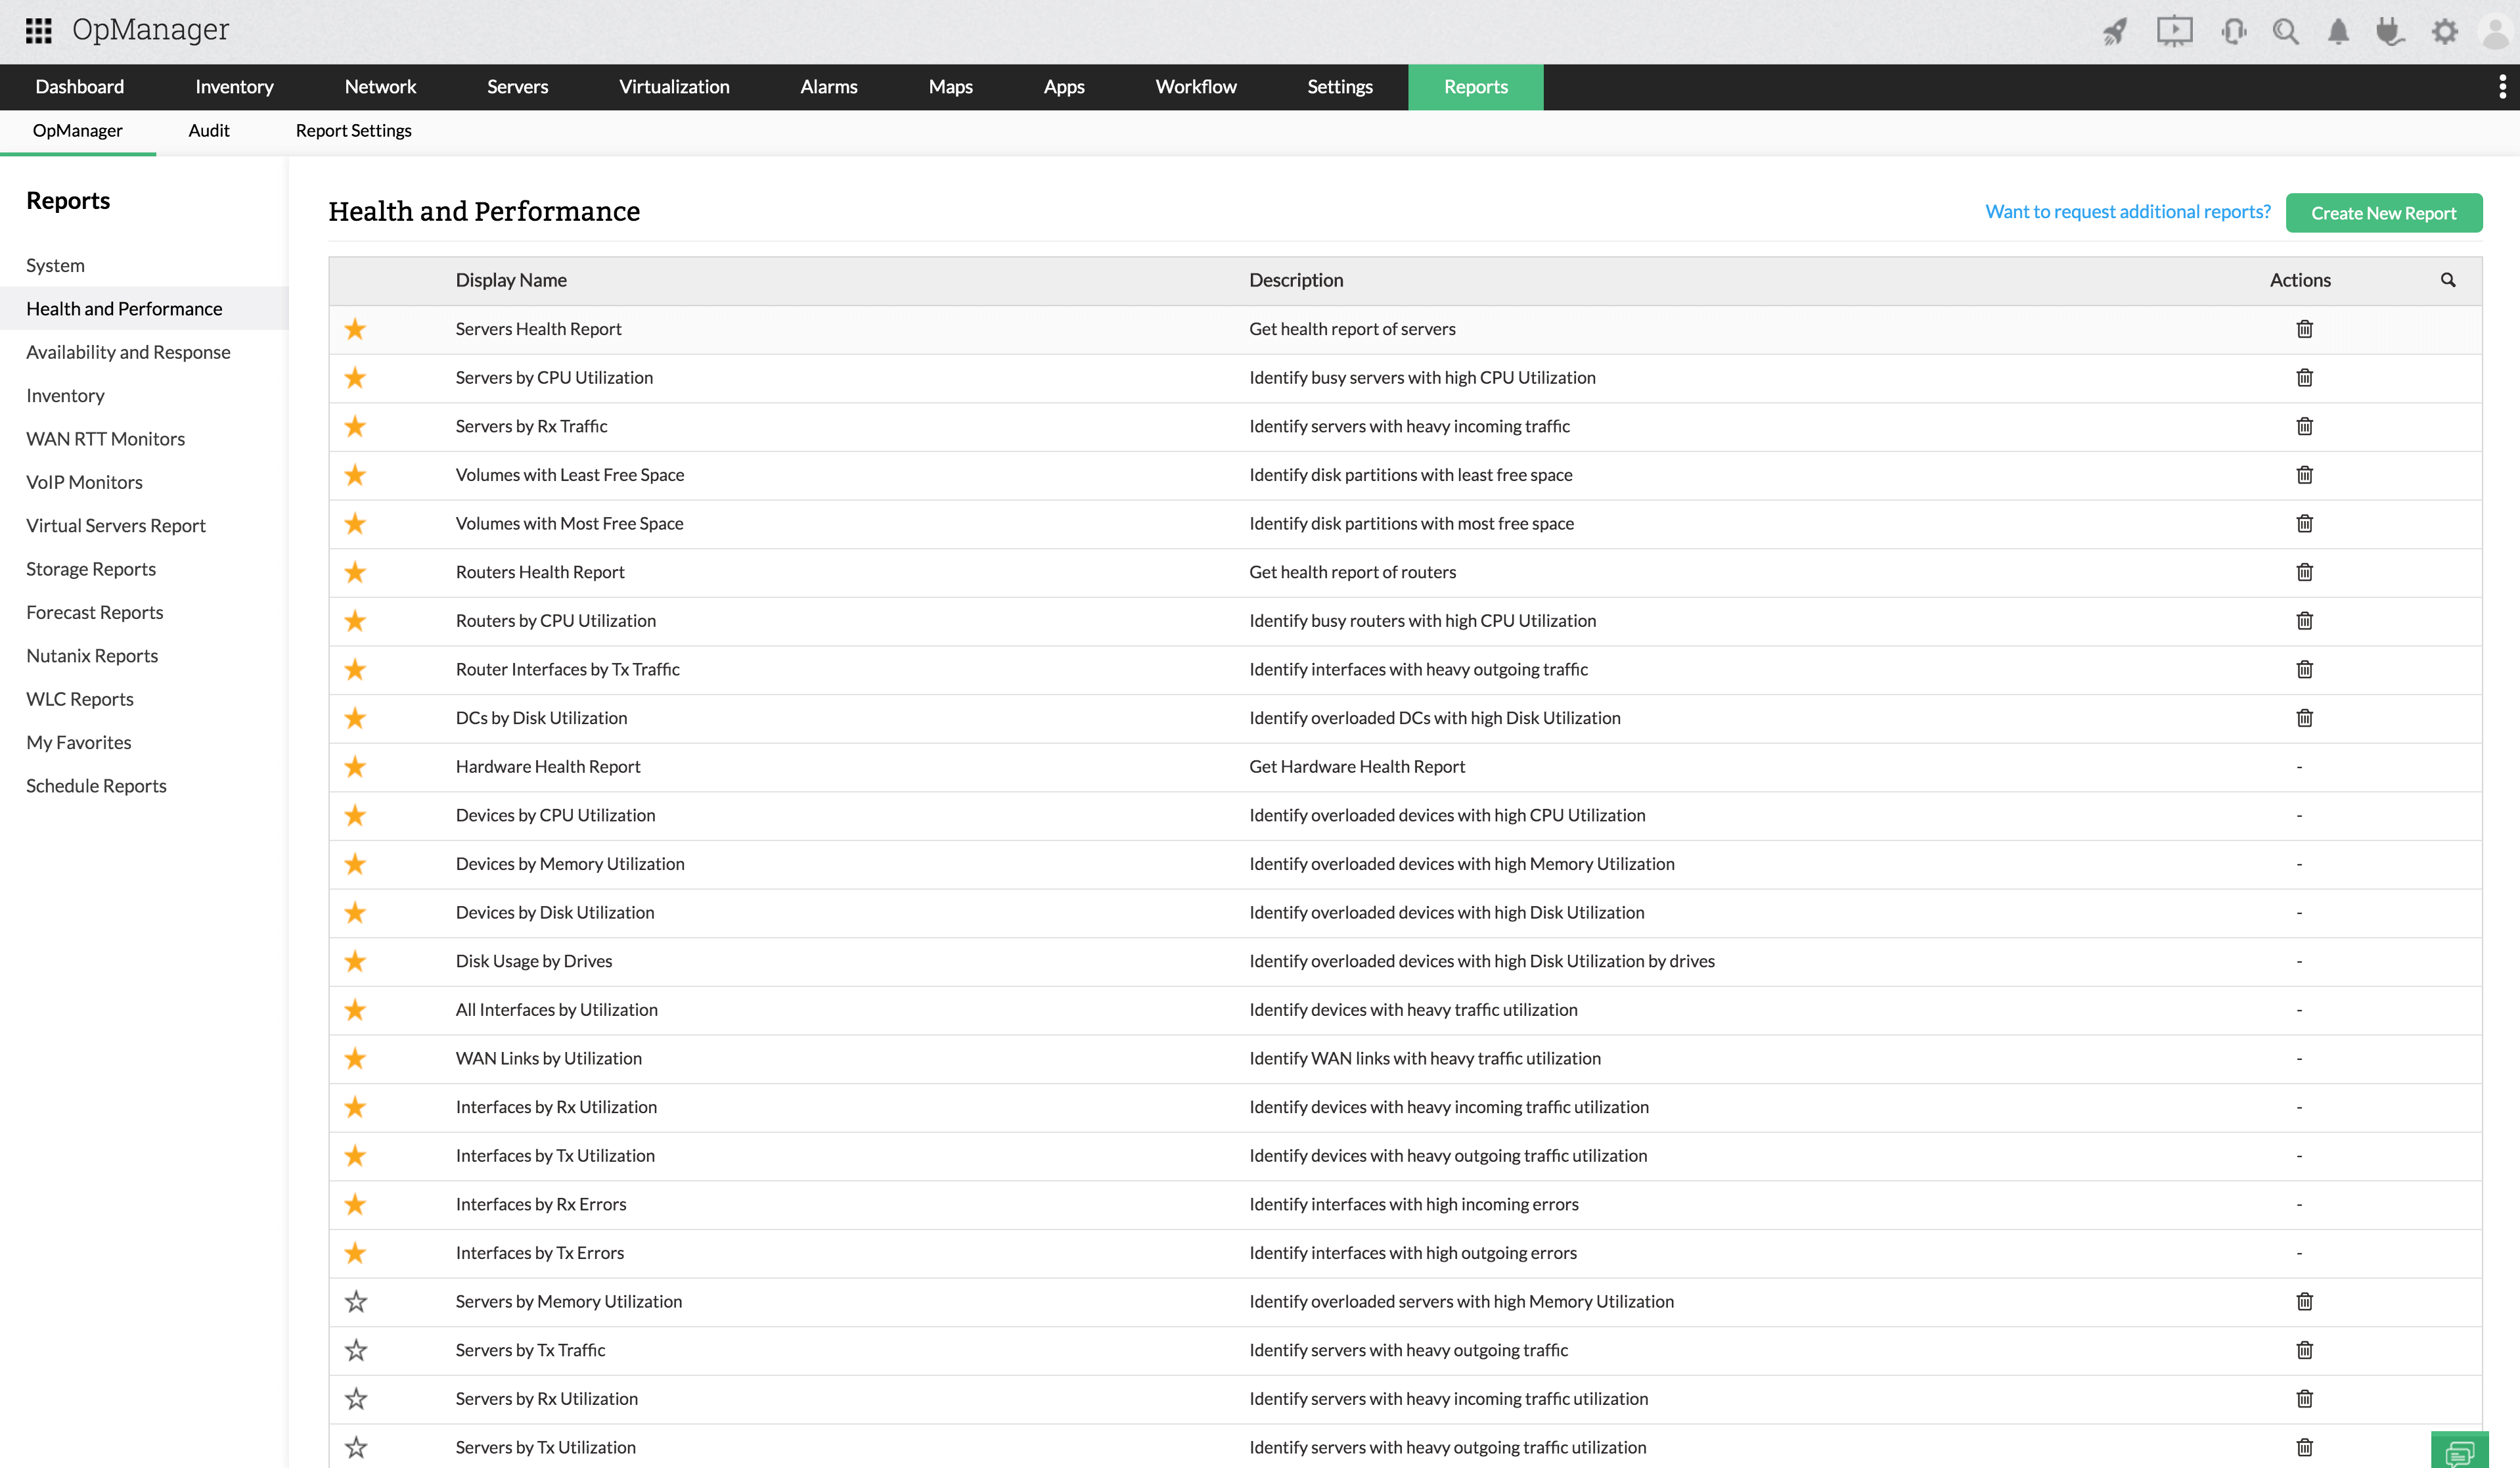
Along with advanced monitoring of critical devices, OpManager supplies reports to help IT admins identify and prevent common issues. OpManager provides a simple interface with more than 100 built-in reporting profiles and over 125 out-of-the-box reports. All the collected data on UCS performance metrics is stored in OpManager's database for detailed analysis and for creating monthly and yearly performance reports.
With OpManager's Cisco UCS monitor, you can view intensive performance reports like:
OpManager's Cisco UCS monitoring comes with server capacity monitoring with its forecasting reports on utilization of critical resources such as CPU, memory, and disk. You can configure to know the exact dates when the resource utilization would reach 80, 90, and 100% of its allocated capacity. OpManager does that by analyzing historical growth patterns and trends using AI and ML-based algorithms. This is helpful to plan your capcity well in advance amd avert indiscriminate purchases.
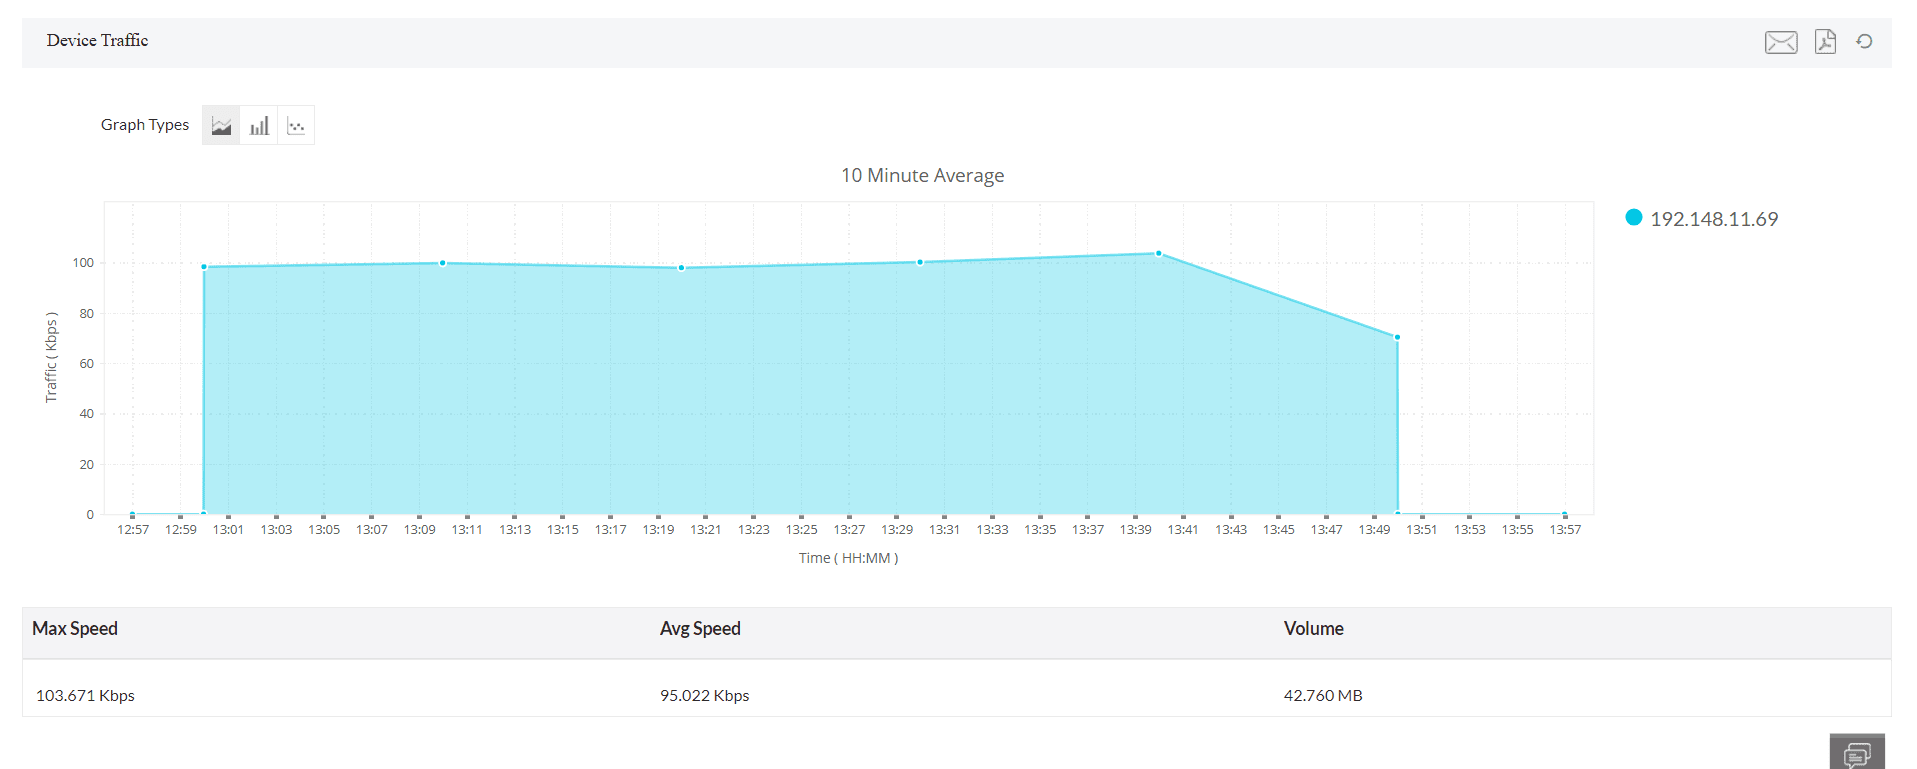
OpManager's capabilities go beyond proactive monitoring of the Cisco UCS performance, availability and health. With its advanced features, including a robust Cisco UCS traffic monitor, administrators gain detailed insights into network dynamics, bandwidth usage, and communication patterns within the Cisco UCS environment. Monitor chassis, rack mounts, fabric interconnects, and other UCS components easily with OpManager, and also monitor Cisco UCS traffic with OpManager's NFA add-on. Get a detailed analysis, and graphs of traffic flow between Cisco UCS devices, avoid down-time, and ensure maximum productivity within your Cisco UCS environments.
