Network admins have one primary responsibility: to ensure the uptime of their network, while not compromising on network performance. However, with modern deployable solutions making their way through the conventional network architecture, this is easier said than done. Although modern solutions are definitely a step up from their legacy counterparts in terms of efficiency, they also bring their own set of management complexities along with them. Network admins have to stay ahead of these complexities while avoiding network downtime, which sure does keep them on their toes.
In their effort to keep things running smoothly, network admins need to measure the efficiency of their network. This is where three key metrics come into play. These metrics help network admins better understand their incident management, and by optimizing these metrics, network admins can ensure high availability of their devices. The three key metrics are:

In any network, the unavailability of a device might lead to severe repercussions, including but not limited to network downtime. Any network downtime may lead to further disruptions in business services, which will bring down the business revenue.
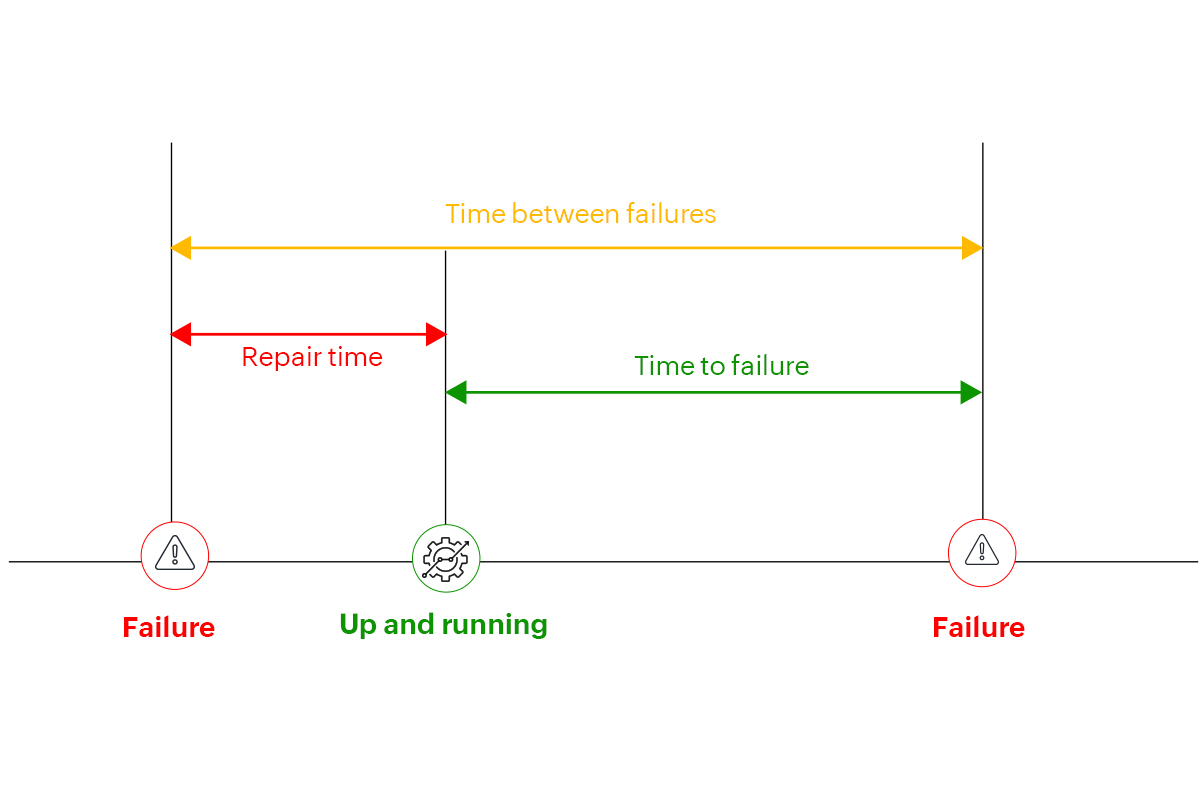
Apart from monetary losses, network downtime also leads to a loss of reputation, which is undesirable. Hence, it is important to make sure that networks, as well as the devices associated with them, must always be available and at their optimum performance. The MTBF is a metric that helps network admins understand how often a device might go through downtime, as well as the average amount of time taken to get the device up and running.
The MTBF is the mean time taken between two consecutive downtime events. Generally, this can be calculated by considering the data set from the period you want to analyze, and then dividing the device uptime during that particular period by the number of failures.
For example, let's consider a router in an enterprise network that experienced downtime four times in a 24-hour period, of one hour each. Now, its uptime will be twenty hours, since there were four hours of downtime in the 24-hour window. So the MTBF can be calculated as:
Frequent issues with the devices in your network will surely be a hassle due to the effect it will have on your network's overall performance. This surely is undesirable, since not only is the network performance affected, but might also lead to network downtime if the issue is left unattended. This is where MTTF comes in. The MTTF is a metric that helps network admins understand the average time taken before a device fails. This metric is used to determine whether a device is ready to be replaced or repaired. A high MTTF might indicate that the device might need frequent replacement at regular intervals, which is highly undesirable. This leads to loss of time and resources that might better be focused on other critical aspects of the network.
The MTTF is the average time between instances of a device running into an issue. This can be calculated by dividing the sum of the operational hours of each device, divided by the number of devices.
For example, let's consider 4 routers. Devices A, B, C, and D last for 10, 12, 14, and 16 hours respectively, before they run into a failure. Now, the MTTF can be calculated as follows:
Network downtime is undesirable since it not only affects the day-to-day business operations, but also leads to the loss of reputation and brand value in the eyes of customers. Although network downtime might be disastrous and I/O teams must do what they can to prevent it, they must also be equipped to handle and rectify downtime as quickly as possible to reduce the extent of damage. The MTTR is a metric that allows network admins to understand how quickly their I/O teams tend to respond to imminent threats and can indicate the readiness of their I/O team.
The MTTR is the average time taken to rectify the fault of a device, right from the instant the alert is received, to the instant the device is once again up and running.
For example, let us consider a router that faced 4 outages in a week, which led to a total downtime of 2 hours. So, the MTTR would be 30 minutes for an outage.
ManageEngine OpManager is a comprehensive network monitoring solution that helps network admins monitor their network, while evading network downtime and eliminating network blind spots. This helps them gain in-depth visibility into your network and also maintain the optimum health and performance of their devices. OpManager—with its power-packed add-ons and integrations—helps network admins receive alerts instantly whenever an issue begins to unfold.

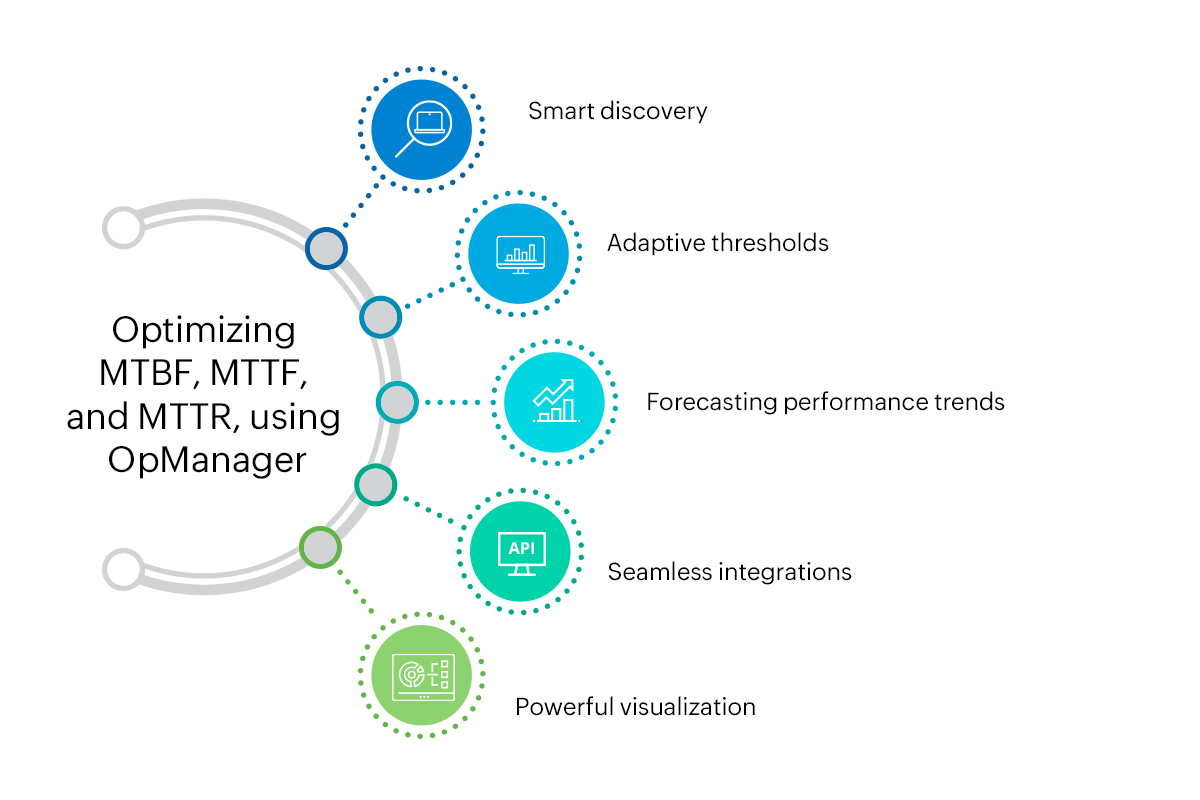
OpManager offers the following functionalities to helps you improve MTTF, while bringing down MTBF and MTTR.
Smart discovery: OpManager, with it's smart discovery feature, helps network admins discover their devices automatically. What's more? OpManager also allows network admins to schedule discovery checks at regular intervals, at their convenience. Learn more.
Adaptive thresholds: Manually configuring thresholds after careful evaluation of a device's historical data and current usage patterns definitely does sound easier said than done. OpManager, with its adaptive thresholds feature, helps network admins automate the threshold configuration process, thereby taking a load off their shoulders. Learn more.
Forecasting performance trends: OpManager also allows forecasting of performance trends for any device or monitor, which helps network admins with capacity planning. Learn more.
Seamless integrations: OpManager is also compatible with the top ITSM tools out there. These integrations can alert network admins instantly in case of a mishap via email, text message, ticket logging, and more. Learn more.
Powerful visualization: OpManager also offers powerful visualization features that offer a needle-in-a-haystack view of your network. OpManager's automatic network diagramming feature helps you gain a comprehensive understanding of your network, making network planning and expansion easier. Learn more.
Learn more about OpManager, or download OpManager's free trial version to get started with next-gen network monitoring.