Network performance monitoring (NPM) refers to the process of continuously measuring, analyzing, and managing the performance of computer networks. It ensures that networks are operating efficiently, securely, and with minimal downtime by monitoring key metrics such as traffic, latency, packet loss, bandwidth utilization, and uptime.
- Objective: Ensure the network is performing optimally, identify and resolve issues proactively, and minimize downtime.
- Key metrics: Latency, availability, packet loss, throughput, jitter, and error rates.
There are several types of network performance monitoring (NPM) that vary based on the specific aspects of the network being observed:
- Real-time monitoring: Provides real-time data on network health and performance. It is used for quick diagnosis and immediate troubleshooting.
- End-to-end monitoring: Tracks network performance across the entire path between two devices, providing insights into latency, jitter, and packet loss across multiple hops.
- Infrastructure monitoring: Focuses on monitoring physical devices like routers, switches, firewalls, and servers that form the backbone of the network.
- Application performance monitoring (APM): Monitors the performance of applications relying on the network, helping identify network-related issues impacting application performance.
- Bandwidth monitoring: Measures the amount of data transmitted through a network over time, providing insights into bandwidth utilization and bottlenecks.
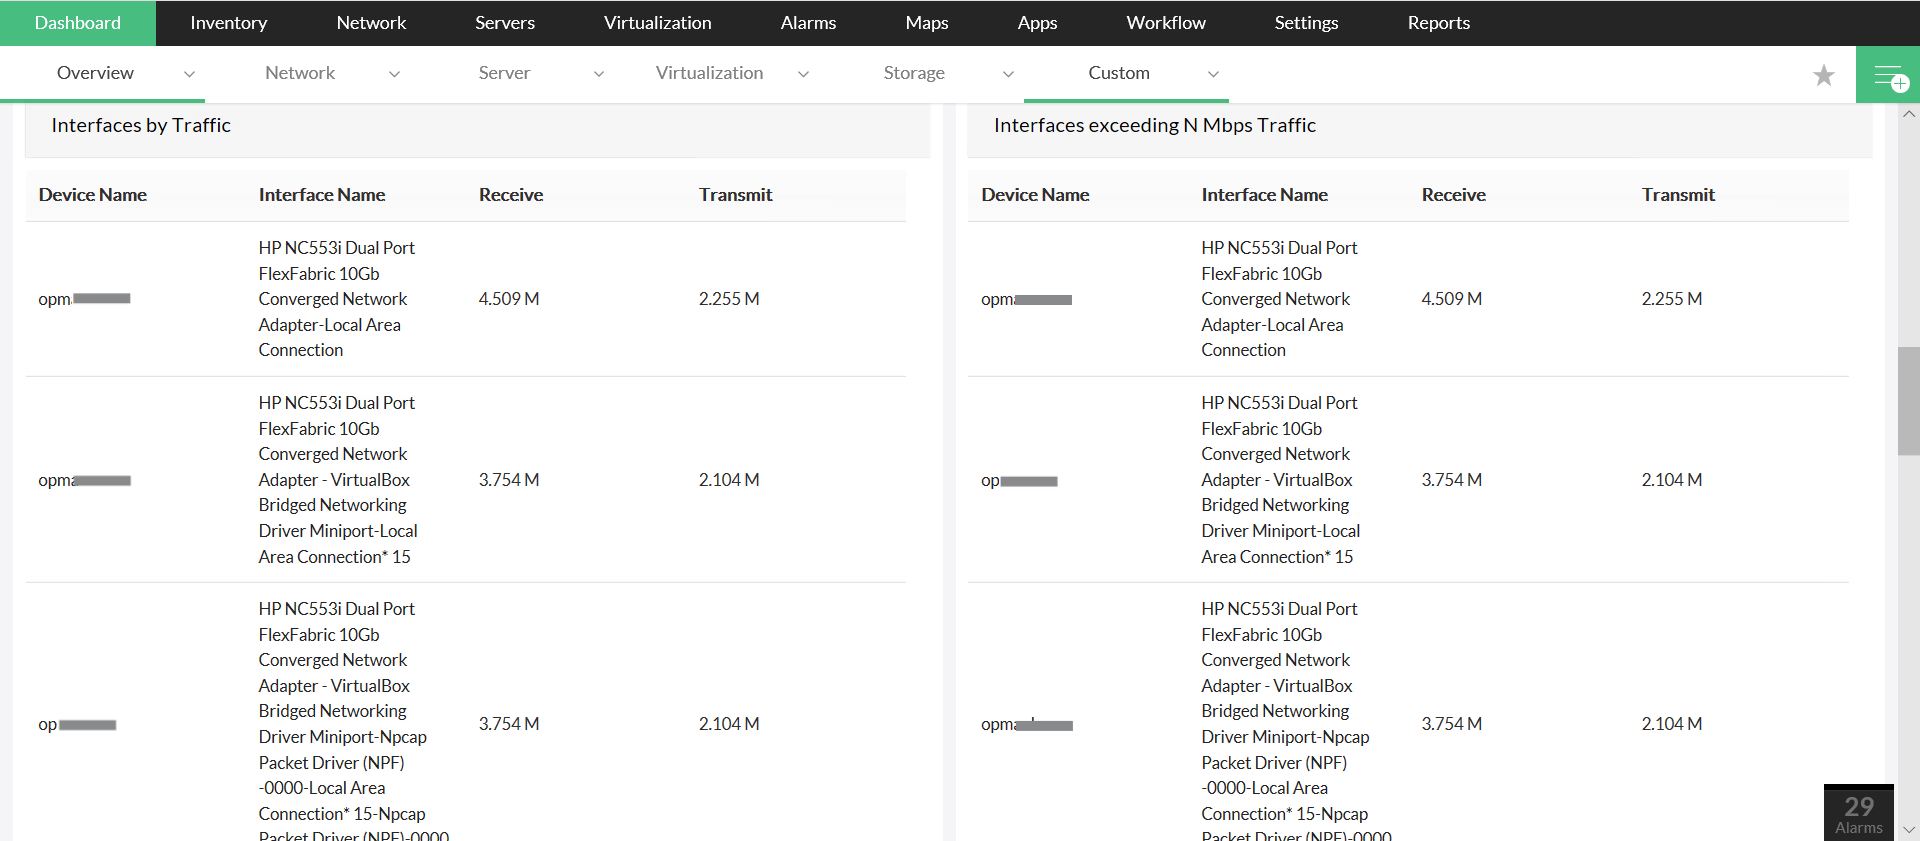
- Traffic analysis: Focuses on analyzing the flow of data across the network, identifying trends, congestion, and anomalies.
Network performance monitoring systems work by continuously collecting data from various points across the network to analyze its performance. Here's how they typically operate:
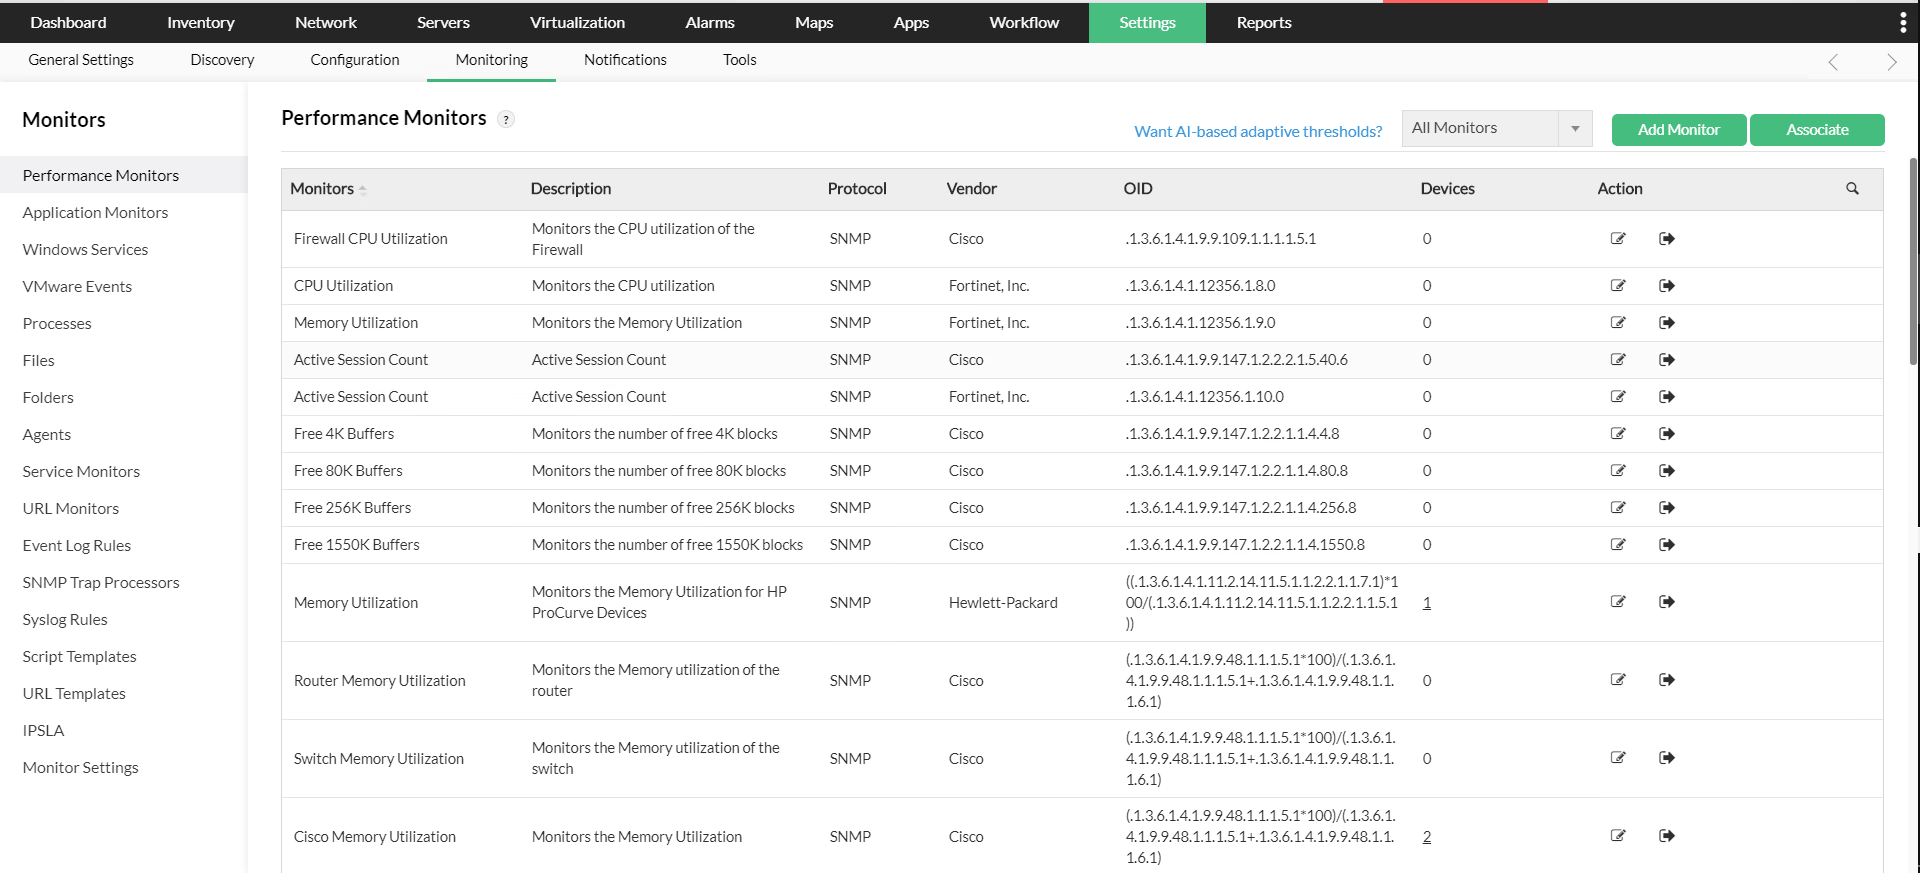
- Data collection: OpManager uses protocols like SNMP (simple network management protocol), NetFlow, sFlow, and WMI to gather real-time data from network devices.
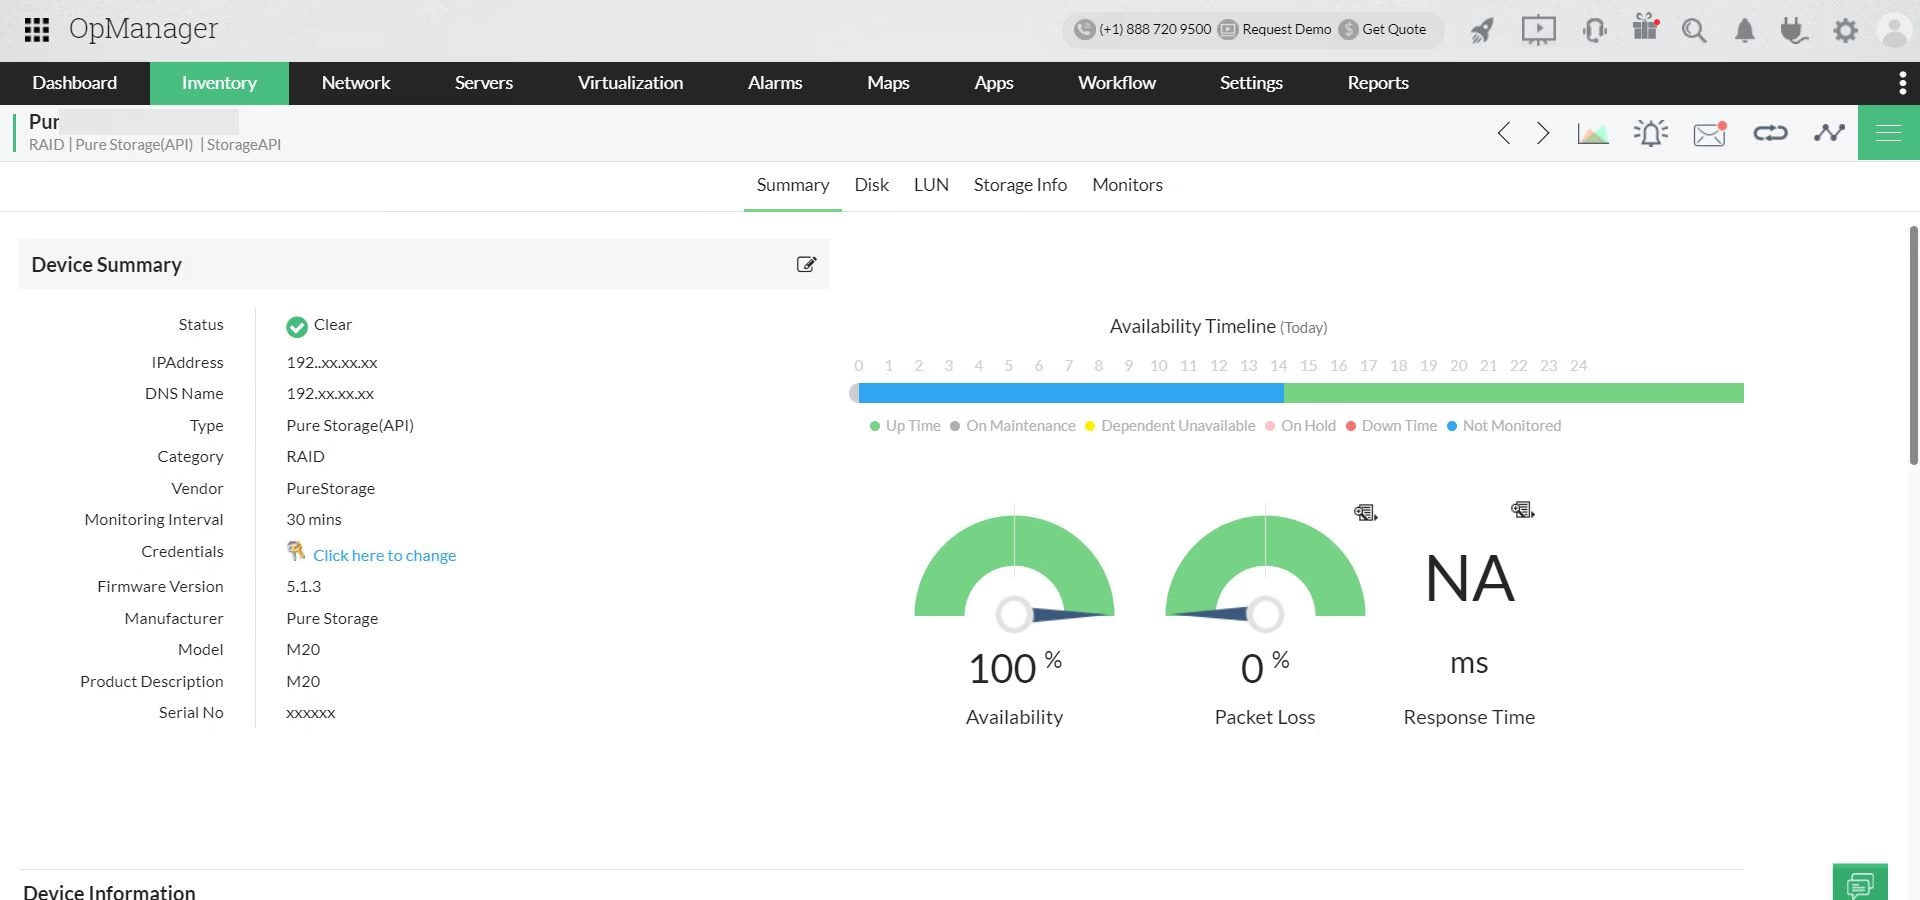
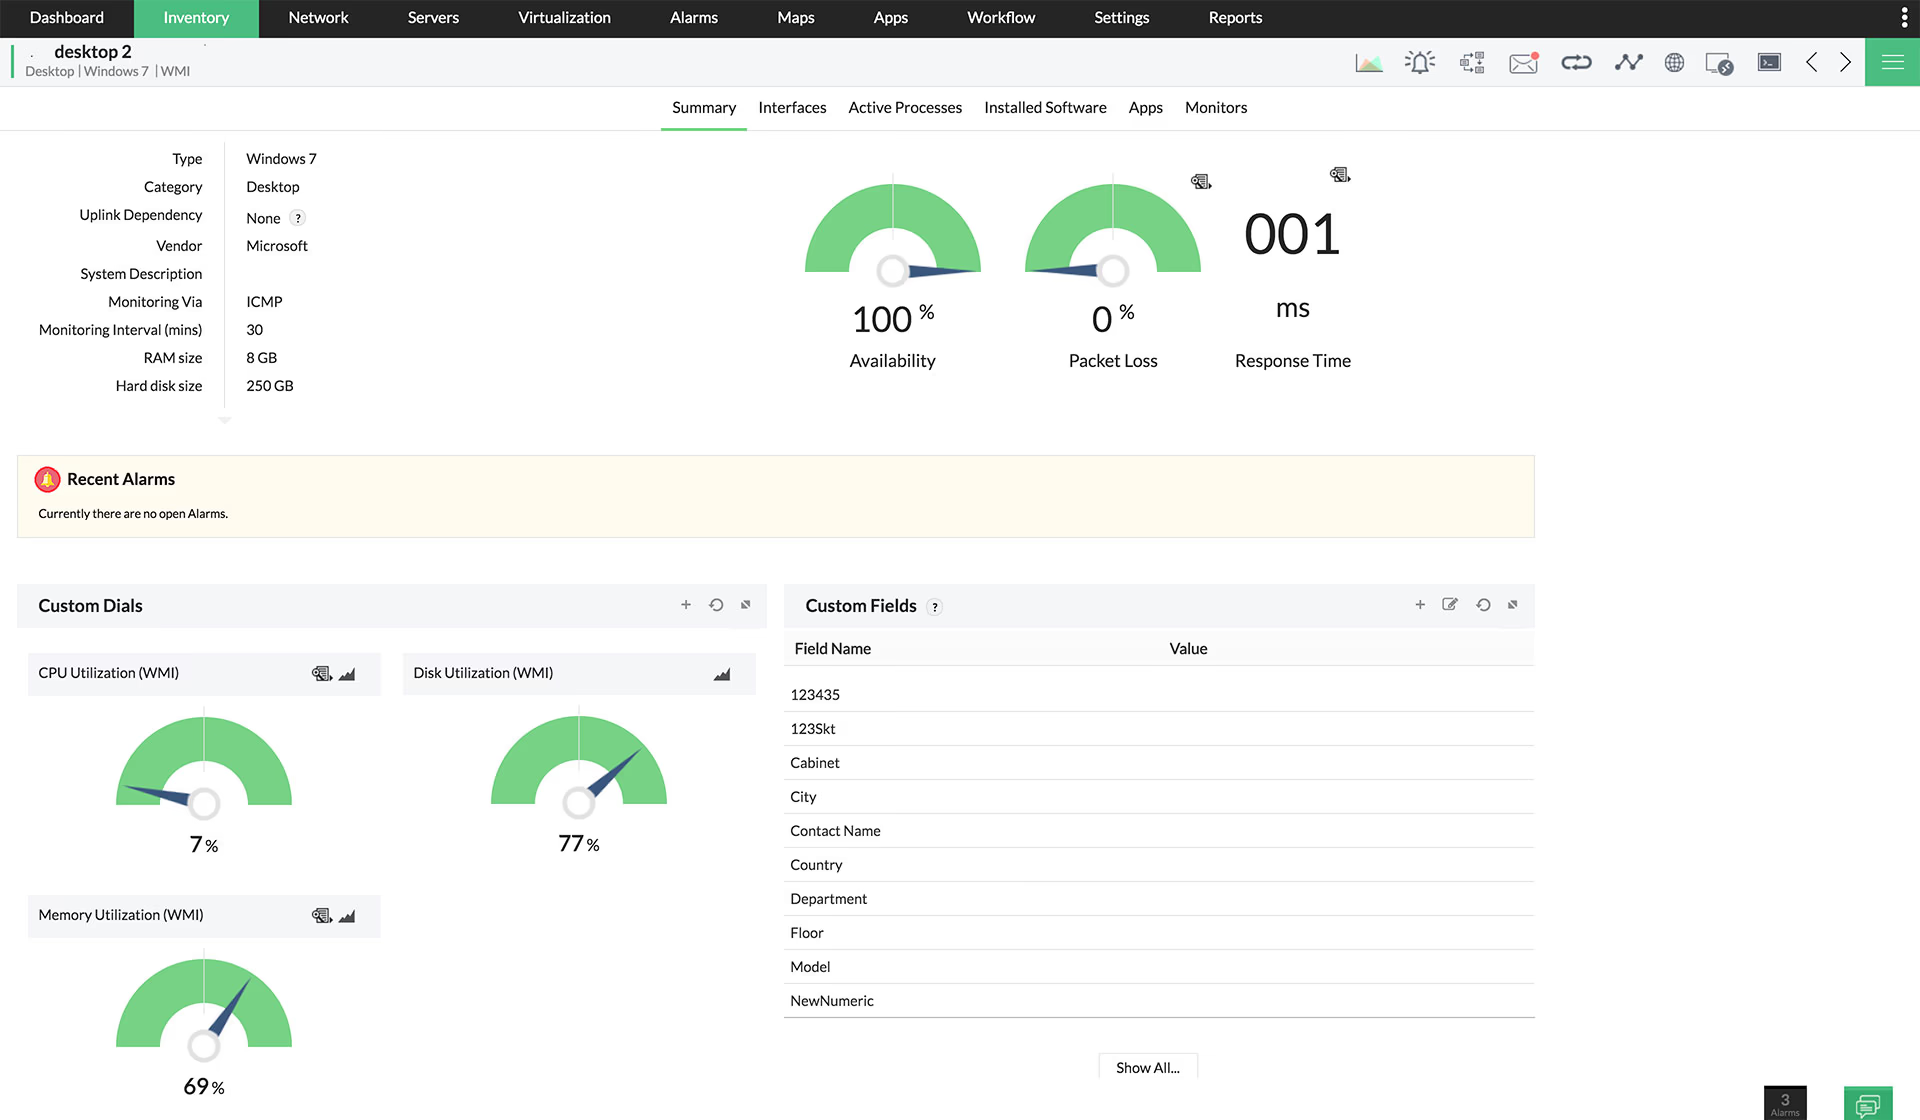
- Performance metrics: These tools measure key performance indicators (KPIs) such as bandwidth usage, packet loss, latency, error rates, and throughput.
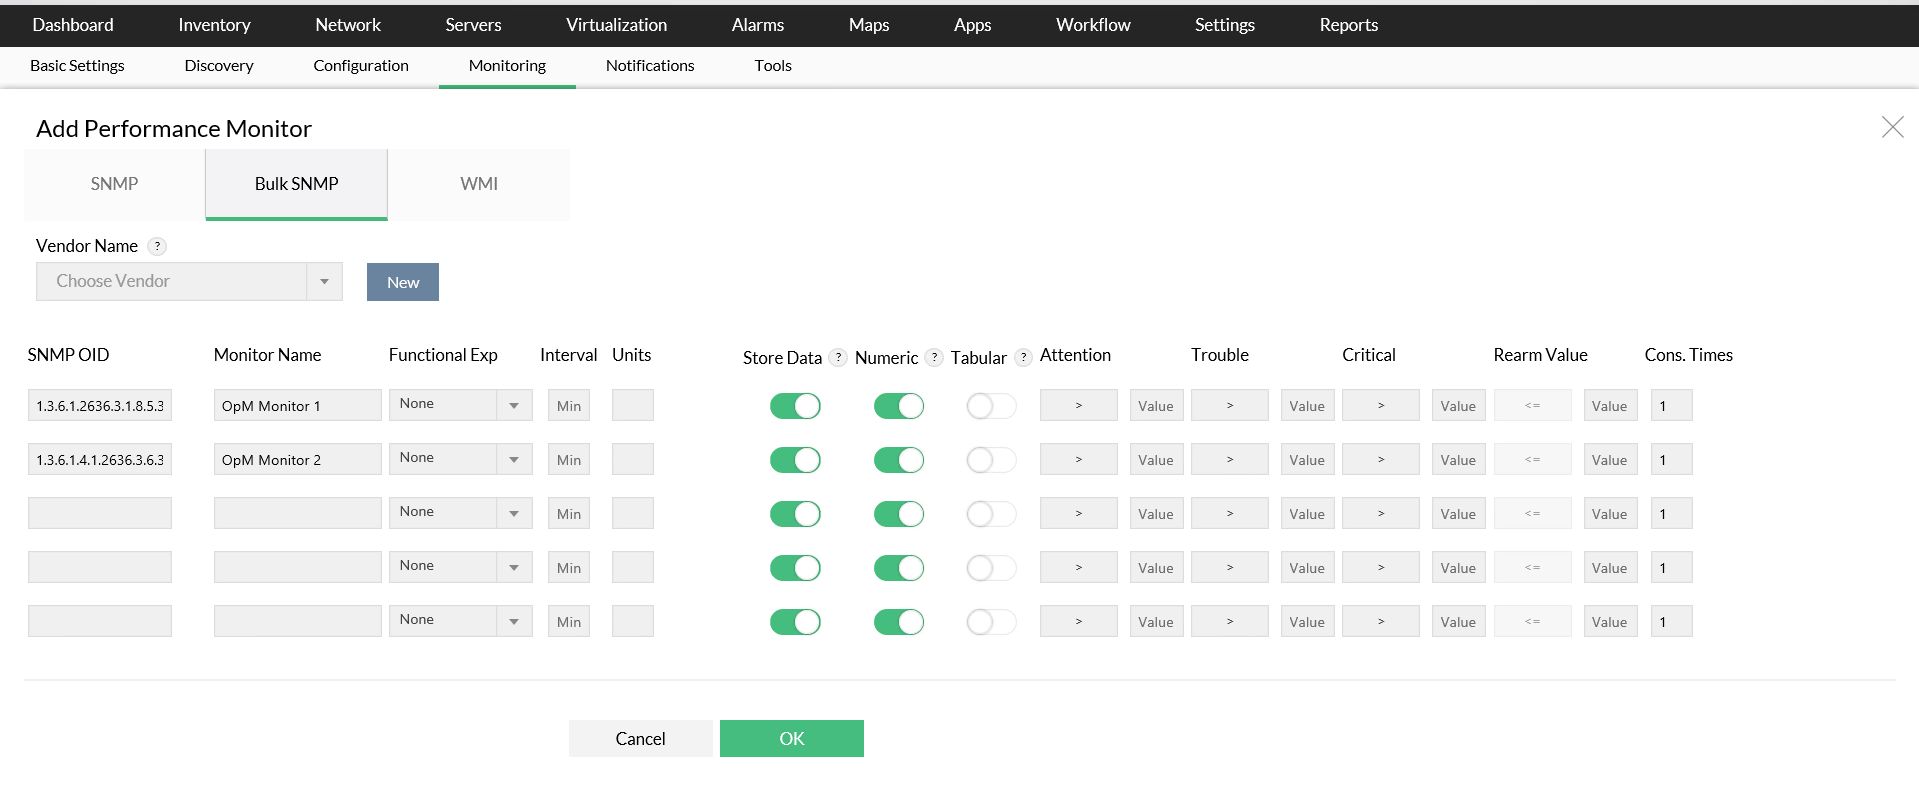
- Thresholds and alerts: Users can set thresholds for critical metrics. When these thresholds are breached (e.g., high latency or bandwidth congestion), the system sends automated alerts.
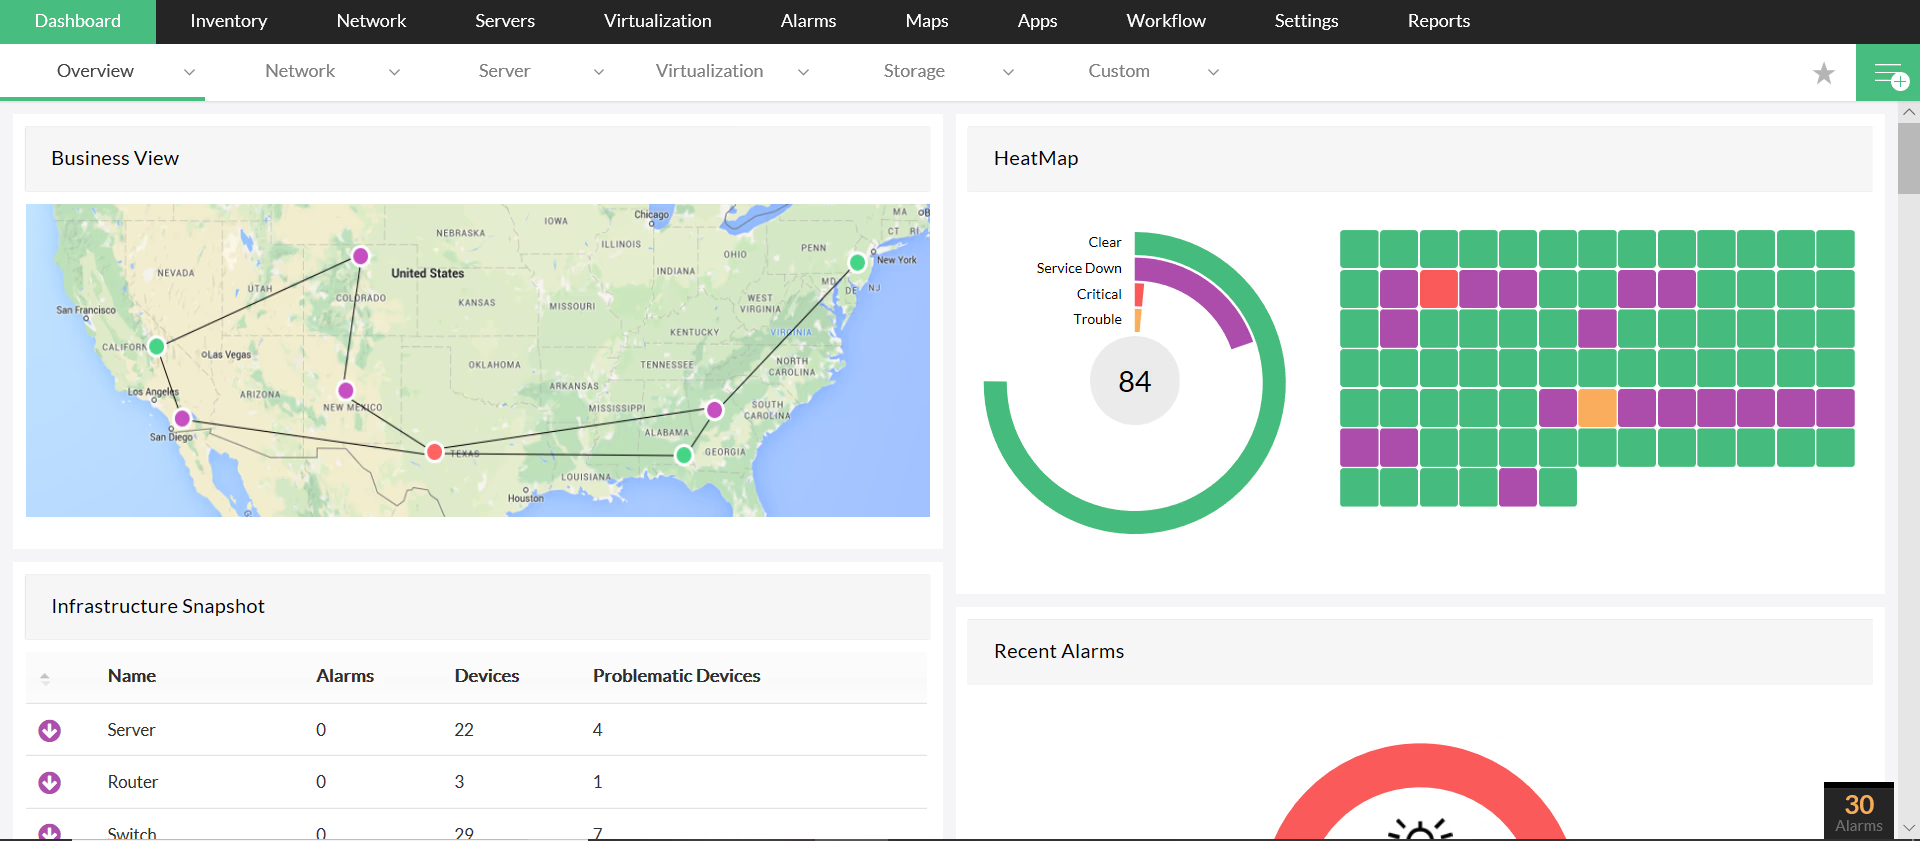
- Visualization: NPM systems display network performance data in the form of graphs, charts, and dashboards, allowing network administrators to quickly identify issues.
- Troubleshooting and reporting: OpManager enables deep-dive diagnostics and historical reports to help troubleshoot persistent issues or improve network design.
Monitoring your network offers several benefits. Key use cases include:
- Proactive issue detection: By continuously monitoring network health, you can detect and address issues (such as high latency, packet loss, or bandwidth overload) before they impact users or services.
- Network optimization: Analyze traffic patterns and optimize network resources to avoid bottlenecks, ensure smooth operation, and optimize bandwidth usage.
- Capacity planning: Assess historical trends to predict future network demands, ensuring your network infrastructure can scale accordingly.
- Security monitoring: Detect unusual network traffic patterns that could indicate security threats like DDoS attacks, malware, or unauthorized access attempts.
- Service level agreement (SLA) monitoring: Ensure compliance with SLAs by monitoring network performance against agreed-upon metrics, helping maintain quality of service for customers.
- Troubleshooting network issues: Identify and resolve network problems quickly by pinpointing the exact location and nature of the issue.
Despite the benefits, there are several challenges in network performance monitoring:
- Complexity: Modern networks are often highly complex, including hybrid cloud environments, multiple devices, and varying traffic types, making it challenging to monitor comprehensively.
- Large volumes of data: Networks generate massive amounts of data, and handling, analyzing, and deriving meaningful insights from this data can be difficult without proper tools and infrastructure.
- Dynamic and evolving networks: Networks are constantly changing with new devices, users, and services being added, making it hard to maintain consistent monitoring coverage.
- False positives: Overly sensitive alerting systems can result in false positives, leading to unnecessary troubleshooting and wasting valuable resources.
- Security and privacy: Monitoring network traffic can potentially expose sensitive data. Ensuring compliance with privacy regulations (such as GDPR) while monitoring is a key concern.
- Integration challenges: Many organizations use a mix of different network devices, operating systems, and platforms, making it difficult to integrate all monitoring tools into a cohesive system.
To maximize the effectiveness of network performance monitoring, consider the following best practices:
- Define clear KPIs: Establish specific metrics that align with your network goals. This may include bandwidth utilization, packet loss, latency, and uptime.
- Set thresholds and alerts: Configure alert thresholds to detect abnormal behavior early. Set up notification systems to inform administrators when a problem arises.
- Monitor end-to-end: Ensure you're monitoring the entire network path from end to end to capture performance degradation and identify bottlenecks.
- Conduct regular audits: Regularly audit network performance and review monitoring data to identify areas for improvement and to spot potential emerging issues.
- Automate troubleshooting: Use automated tools that can diagnose problems and recommend corrective actions, reducing manual intervention and improving response times.
- Optimize bandwidth: Use traffic analysis tools to understand traffic patterns and optimize bandwidth usage. This helps prevent congestion and improves overall performance.
- Secure monitoring: Ensure that monitoring systems are secure, and sensitive data is encrypted, especially when monitoring is done across public networks or third-party systems.
- Use historical data: Leverage historical performance data for capacity planning, trend analysis, and root cause analysis of recurring issues.


