A basic understanding of the network is essential for effective network monitoring. Devices and interfaces form the basis of a network. A network interface can be a networking hardware or a software interface. Using an interface monitoring software, you can monitor interfaces of each and every network device from a single screen. Monitoring network interface performance is important in identifying the root cause of performance degradation and network bottlenecks.
OpManager provides comprehensive network interface monitoring with advanced bandwidth and flows analysis to analyze and monitor interfaces like routers. OpManager monitors interfaces using monitoring Agent based or SNMP based and provides a single customizable dashboard to view and analyze bandwidth performance and network traffic for your IT network. You can check the availability status of interfaces and monitor traffic speed on the interface, errors, discards, etc. using OpManager.
OpManager recognizes and monitors more than 290 different interface types out-of-the-box. When an interface is discovered using OpManager, it automatically associates a pre-defined template with the necessary monitoring interval and optimal threshold limit for utilization, errors, and discards. A new interface template with pre-defined values can be created and associated with interfaces in bulk or the existing monitoring template can be edited to suit your network monitoring requirement. Using OpManager, network admins can set a common monitoring scheme for many interfaces of the same type instead of having to configure for each interface individually.
The monitoring agent enables monitoring of interface traffic and triggers alarms when predefined thresholds are exceeded.The monitoring agent provides traffic data for interfaces on Windows servers. The monitoring agent gathers all the information without using the SNMP protocol and it identifies both local and virtual adapters using the Windows API and fetches essential metrics such as inOctets, outOctets, inDiscards, and more, transmitting them to OpManager for analysis.
OpManager, the comprehensive network interface monitoring tool, supports network switch monitoring in a hierarchical inter-networking environment. The core switch is the high-capacity physical backbone of a network. It handles routing, forwarding, and also serves as the point of contact for a wide area network (WAN) or the internet. The distribution switch links the core switch with the access switches. It acts as a subgroup for the core switches and is used for setting up distribution points in a large organization. Access switches connect the majority of devices to the network with high-density ports. Using OpManager, you can discover all the switches in a network by discovering the core switch. OpManager automatically discovers and classifies the rest of the interfaces mapped to the core switch. You can also configure uplink dependency to prevent unnecessary alarms when the core or distributed switch goes down. It associates the related interface template configured automatically and places them on a switch map. The switch ports are also discovered and intuitively placed on a business view (maps) which helps you graphically visualize your entire switch network.
OpManager monitors various interface metrics like link speed, hop count, or time delay etc. Router metrics are used to make routing decisions by a router and is a part of the routing table. A router metric is typically based on information such as path length, bandwidth, load, hop count, path cost etc. Manual update of description for each and every interface in a network is a time-consuming process. OpManager simplifies interface monitoring by automatically updating the description of metrics.
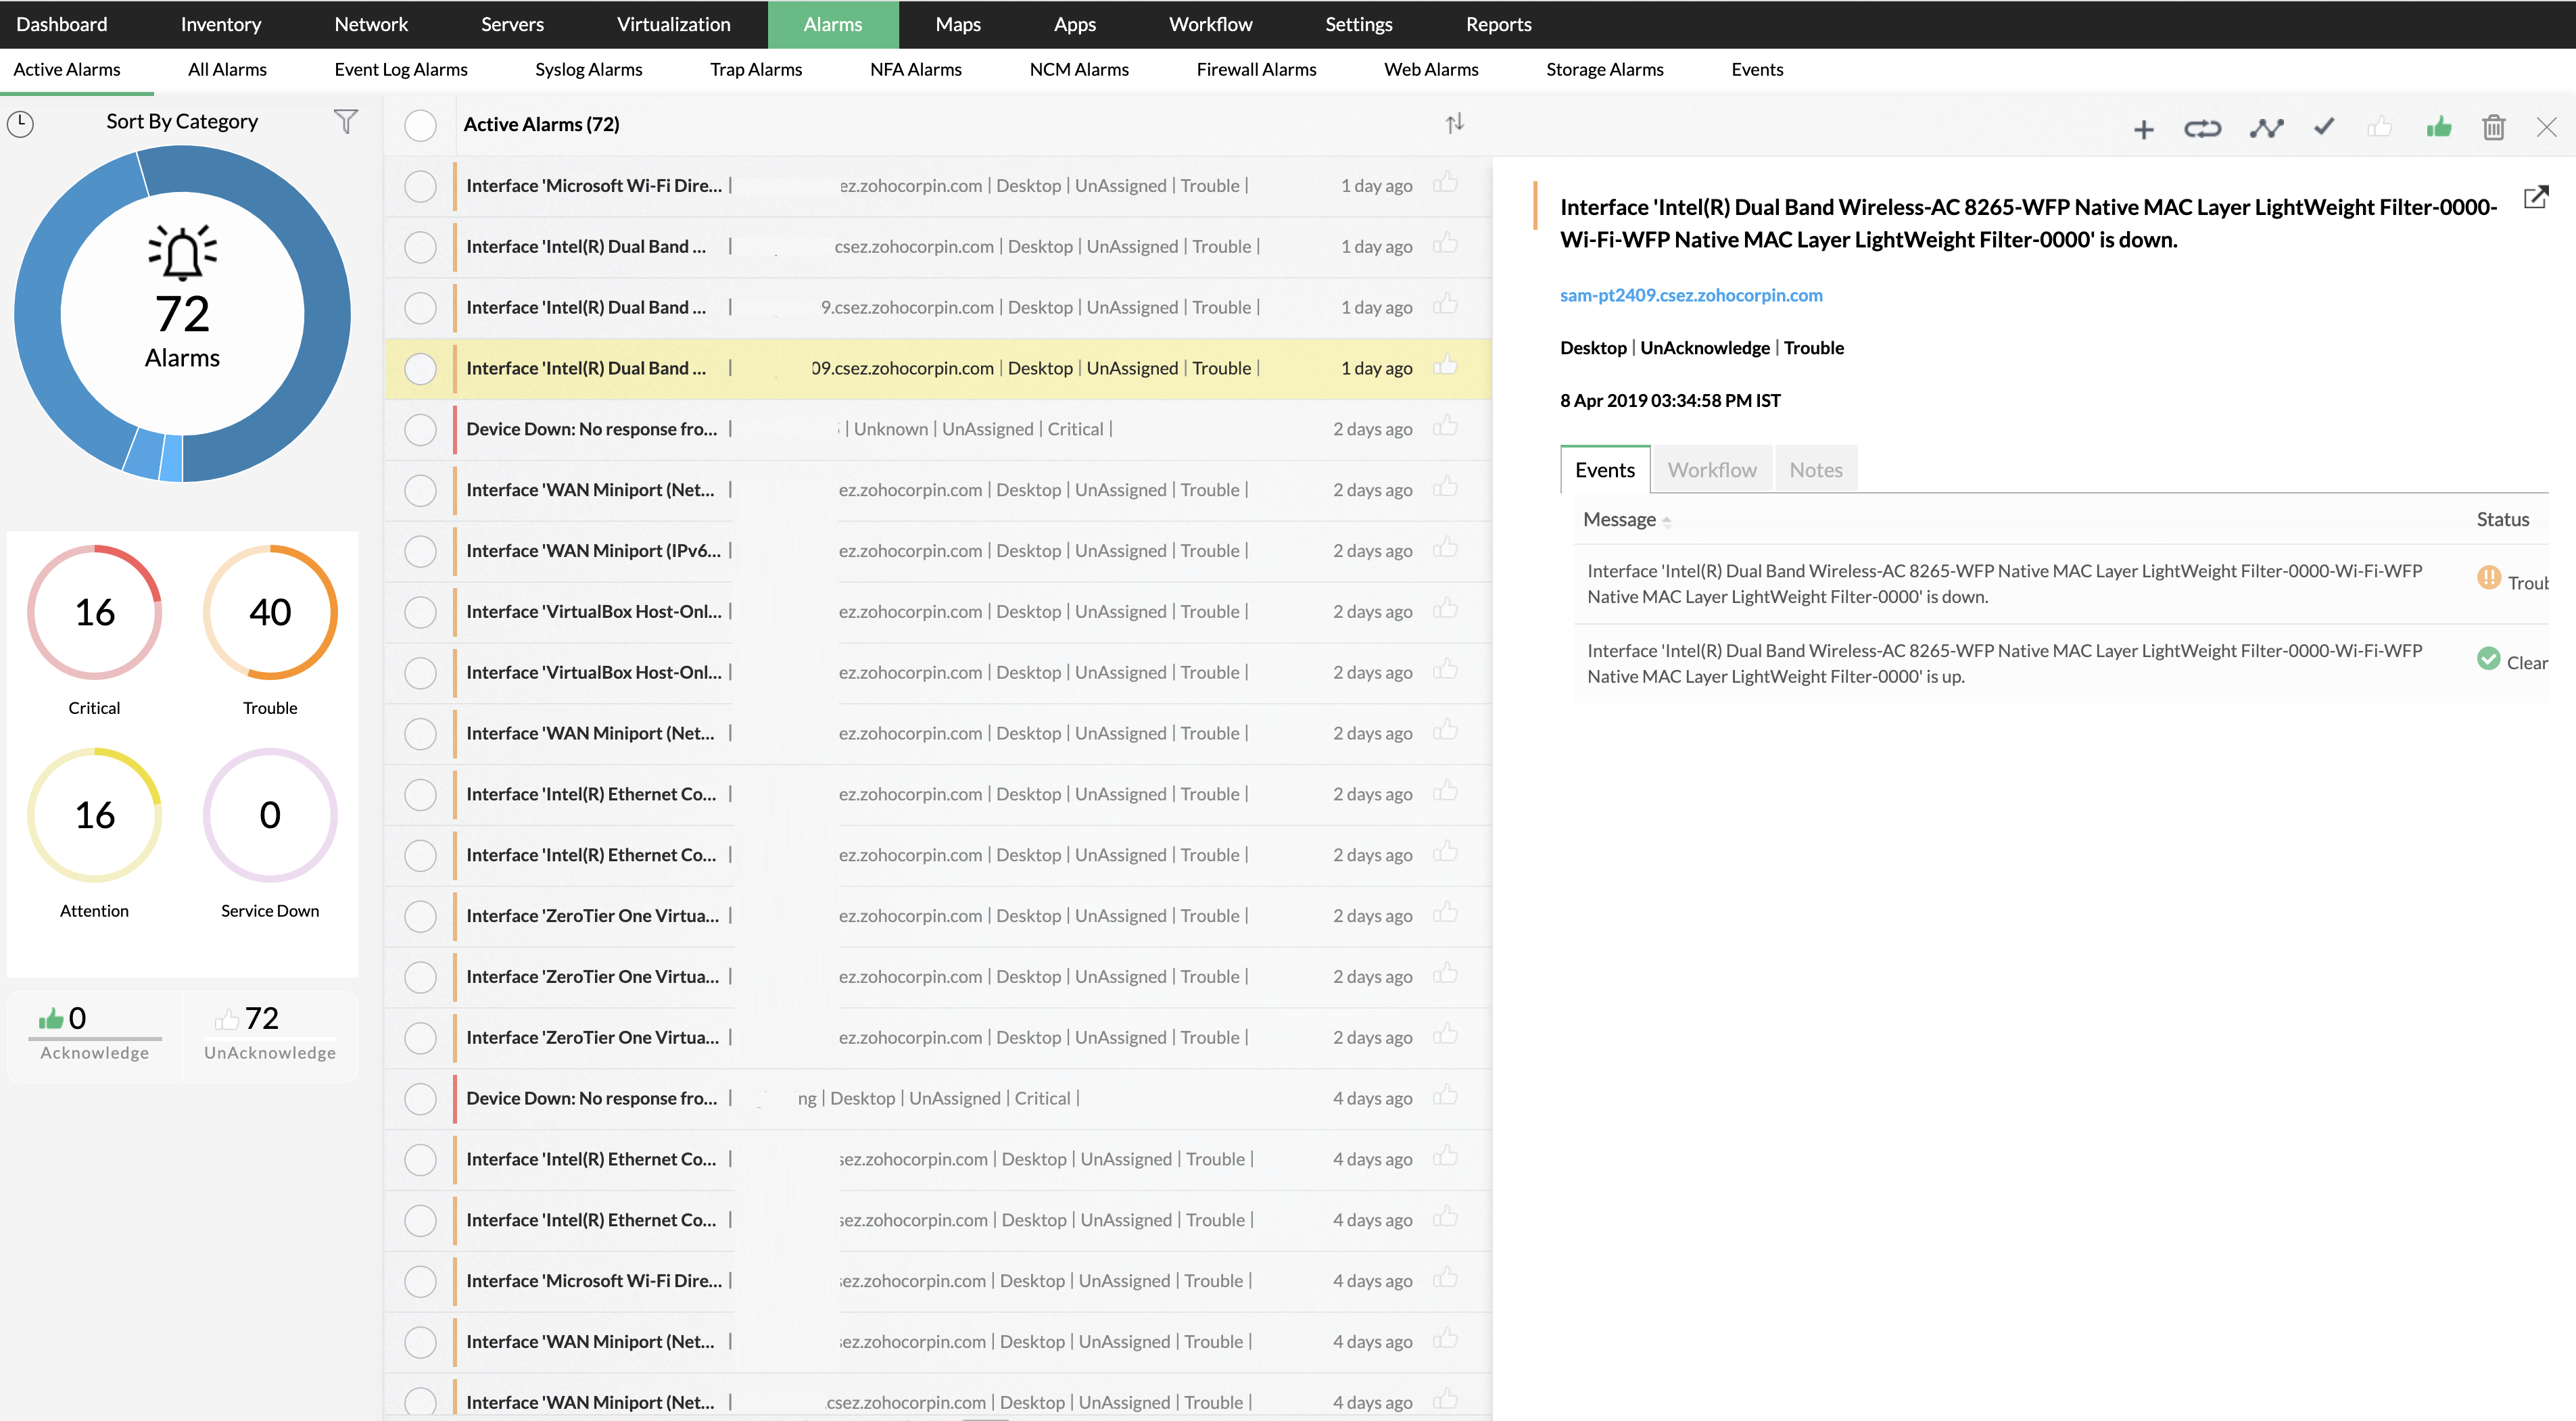
OpManager simplifies the process of interface management by implementing advanced alert monitoring capabilities. OpManager helps you identify the root cause of interface problems and provides color-coded alarms which are presented in a user-friendly format. Network administrators can view the event history associated with an alarm and manually clear or delete the alarms. OpManager also provides Business views which helps you group the interfaces together and view it on a map to provide a graphical representation of devices according to the business service they cater to. This helps you ensure the availability of business-critical interfaces at all times and helps in quick troubleshooting.

OpManager provides detailed interface graphs for Discard Rate, Interface Utilization, Packets, Interface Traffic, Errors and Discards, Error Rate, etc. in the interface snapshot page of individual interfaces. These graphs are useful in monitoring the performance of interfaces over a period of time. The graphs can also be generated as a report which can be used for auditing or presentation purposes. OpManager, by default, provides over 200 in-built reporting profiles to simplify network interface management.
Monitor interfaces in your network today! Download OpManager, the efficient and affordable network interface monitoring tool.