OpManager is a network activity monitoring tool that enables IT admins to track even the smallest activity on their networks in real-time. This way, IT admins can minimize downtime and the mean time to resolve (MTTR).
On a granular level, there is a vast amount of activity happening on each network device in the IT infrastructure of an organization, like packet transmission, messages from network protocols, device status events, etc. Network activity becomes a bread crumb used to identify network bottlenecks when an issue is detected, so even the most minute network activity should be monitored as it directly impacts overall network performance, health, and uptime. Network activity is monitored with the help of a network monitoring tool like OpManager.
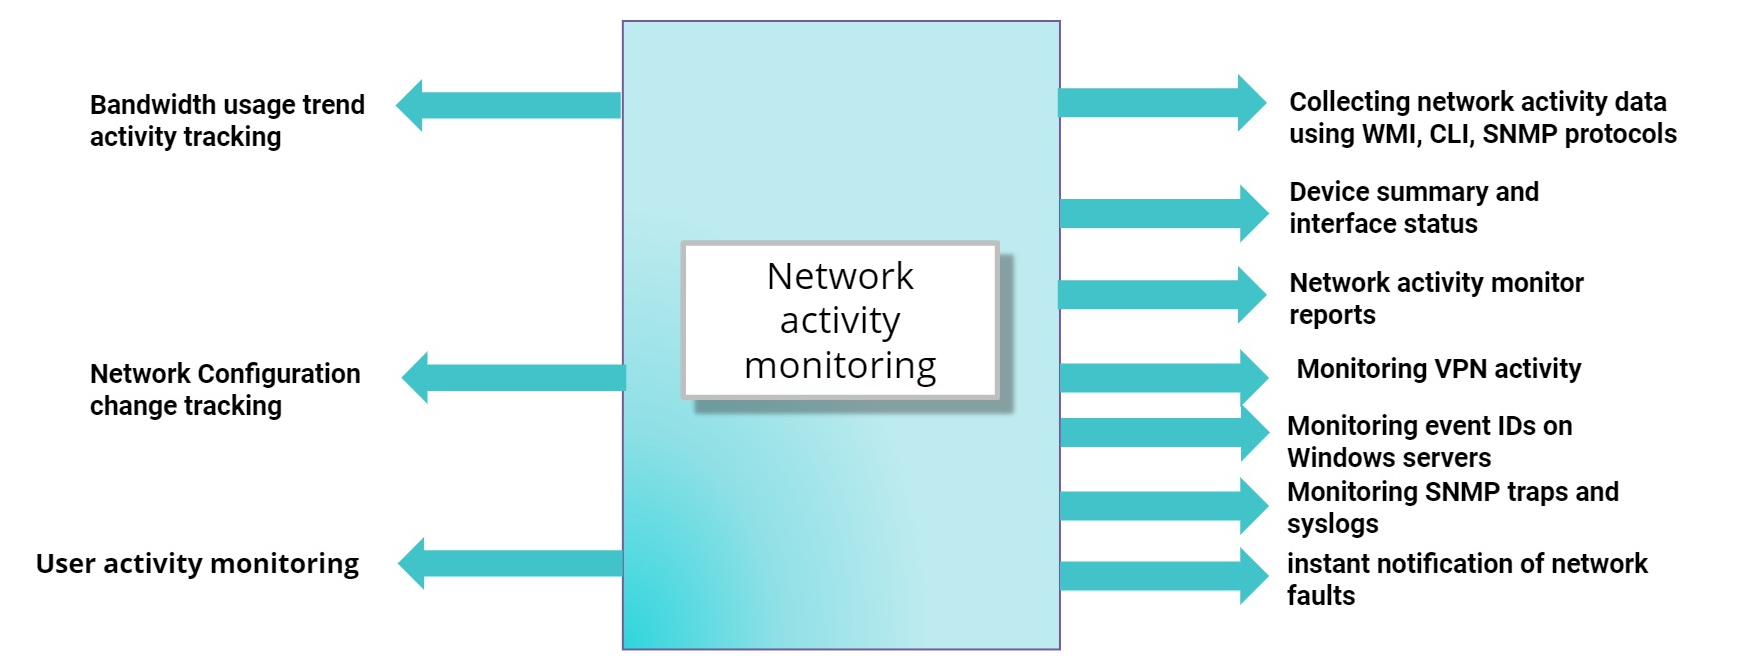
For a better understanding of how and which network activities can be observed, monitored, and analyzed, they can be classfied into two types: device level and user level.
Device level: Each and every device, port, interface, firewall, and application in a network needs to be monitored for activity to keep the network in check and improve uptime. This can be accomplished by:
User level: The network activity of every IT employee and their device, along with their VPN connections, internet usage trends, etc. need to be monitored by optimized network activity monitoring software that uses user activity monitoring (UAM).
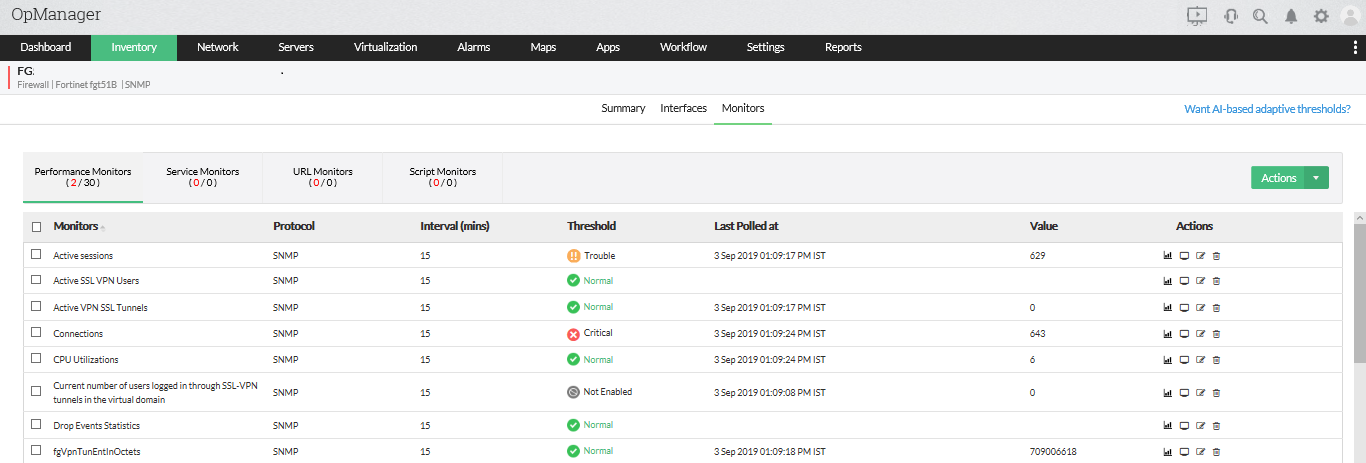
SNMP monitoring: Using an SNMP credential, OpManager sends an SNMP request to the SNMP agent running on the device being monitored, and receives a response. This response contains data about network activity.
WMI monitoring: Using the WMI protocol, OpManager, Windows network activity monitoring software, can monitor Windows server performance, Microsoft Hyper-V devices, Windows services, event logs, Exchange servers, files, folders, Active Directories, log files, and SQL servers.
CLI monitoring: OpManager uses the CLI protocol, Linux network activity monitor software, for Linux device activity monitoring. For non-SNMP devices, the CLI commands fetch network activity data for OpManager.
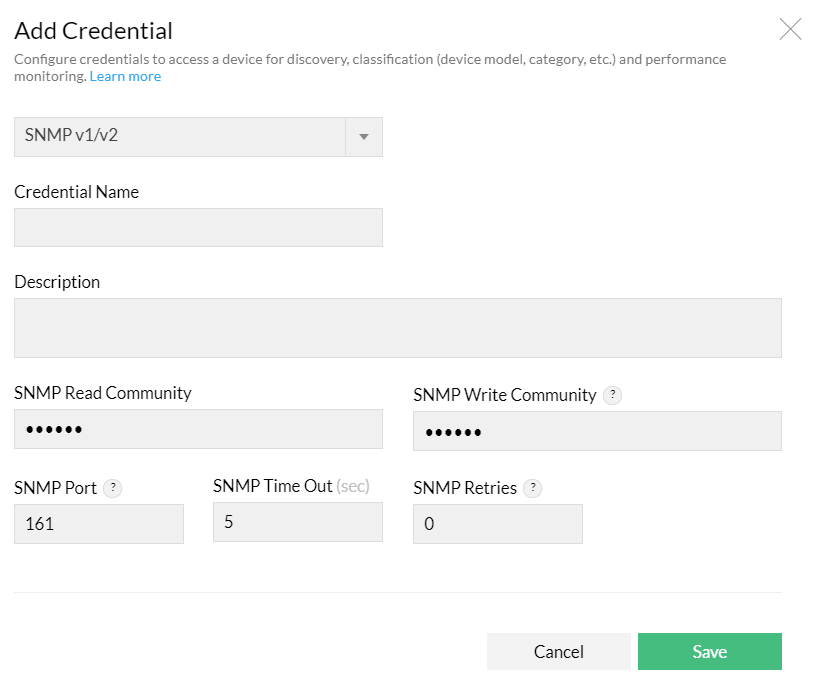
Via SNMP, devices being managed with OpManager provide network activity data using the MIB and OID files that describe device status. SNMP traps are encrypted alerting messages containing information on system status and configuration in network devices with IPs. OpManager can process up to 300 SNMP traps per second. Information from traps raised is helpful to solve latency and packet loss issues.
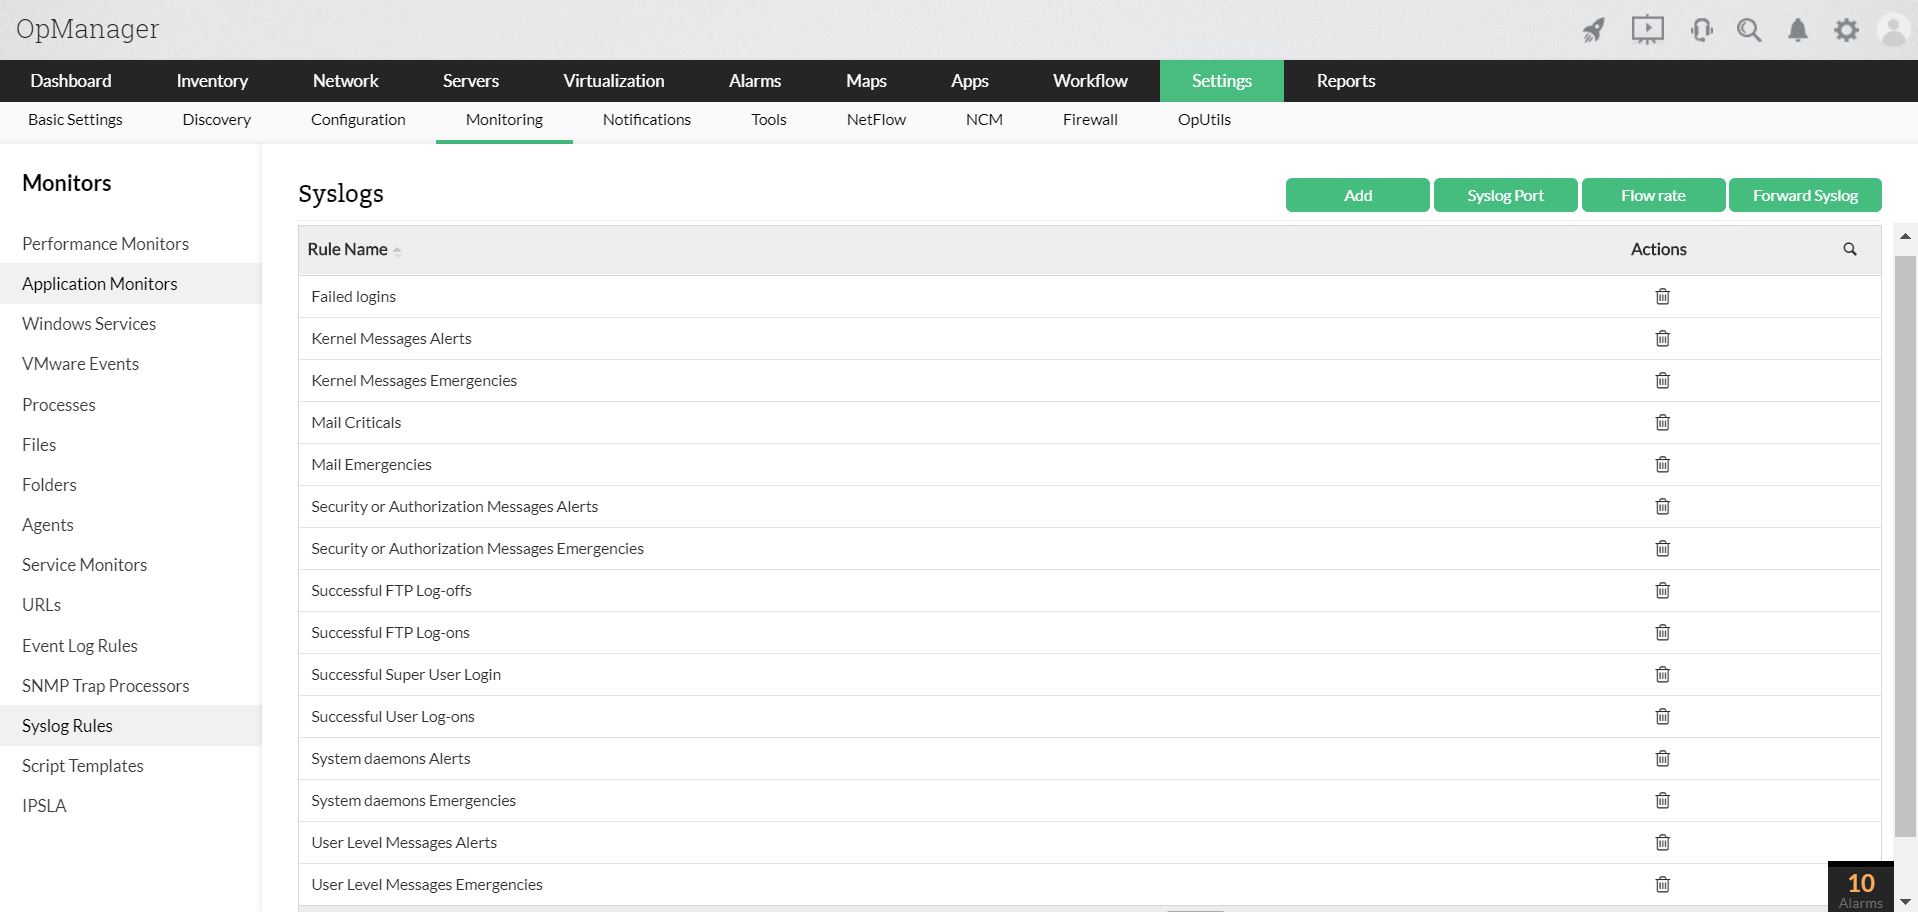
OpManager follows a rule-based methodology of fetching syslogs via the User Datagram Protocol (UDP), reading the syslogs, and associating them with Notification Profiles to notify IT admins. Alarm messages and alarm severity can be set up for intelligent alerting.
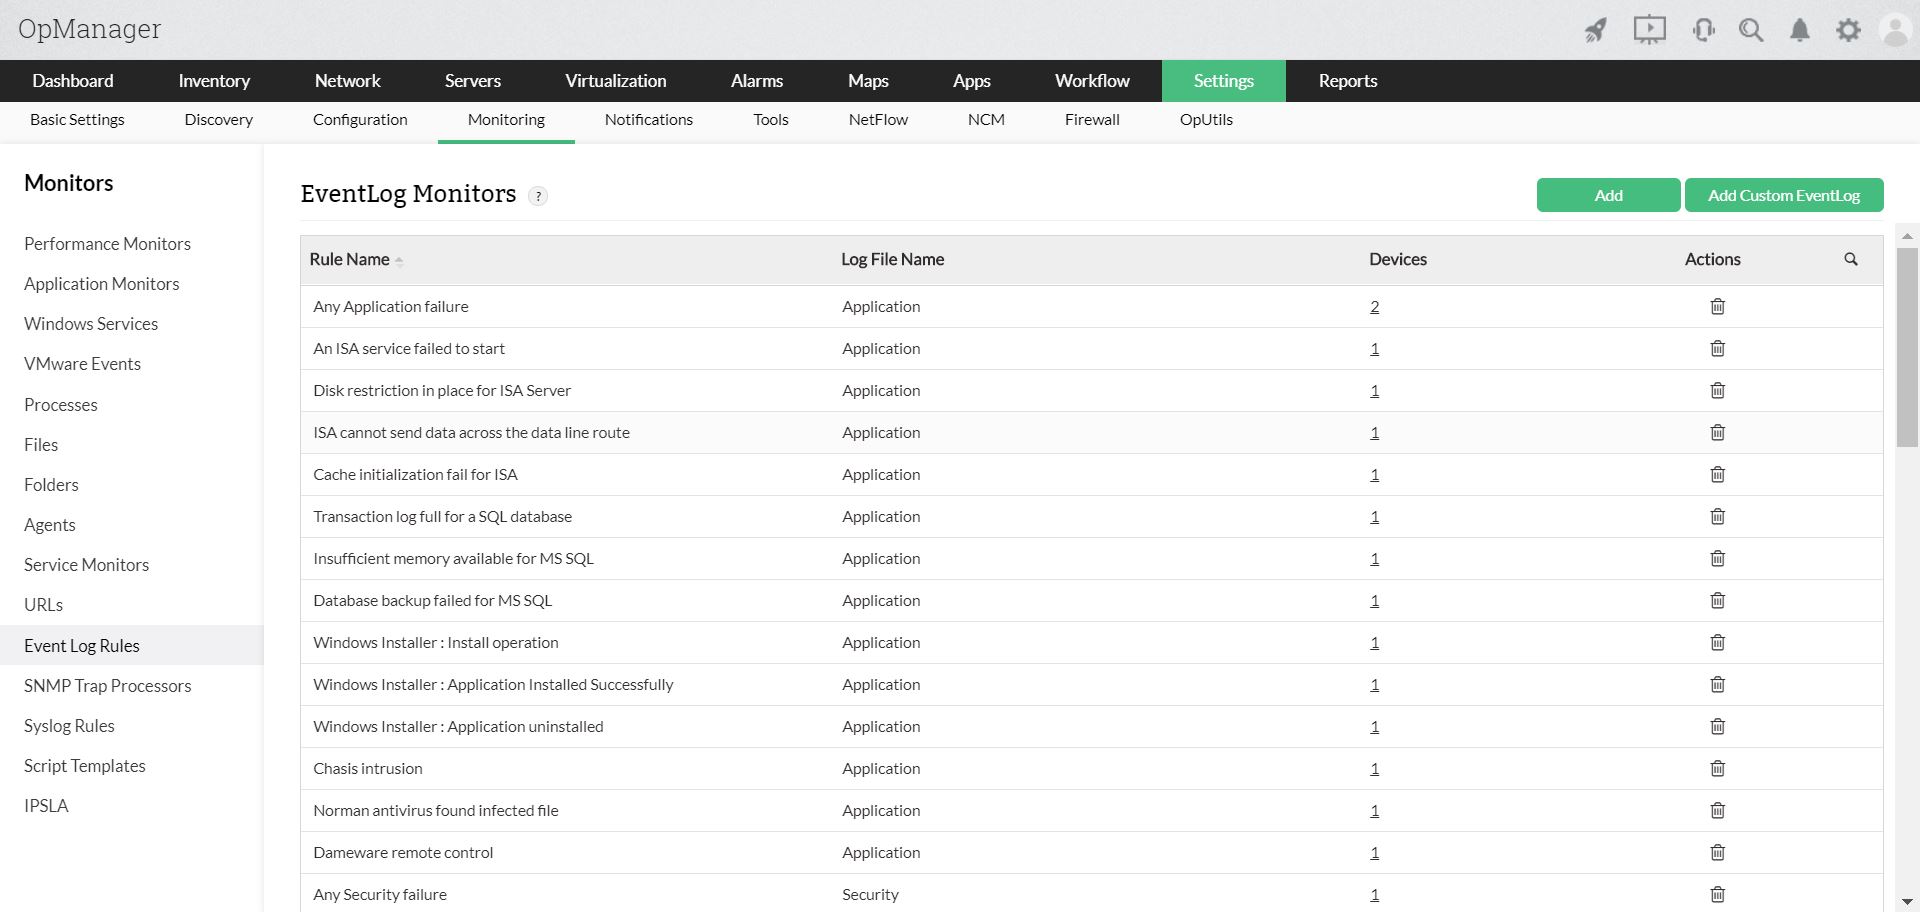
The Windows event log is a service that stores program, security, system, and application logs occurring in Windows devices. OpManager collects event logs from monitored devices using the WMI protocol, and provides 50 EventLog Monitors right out of the box. OpManager enables IT admins set up event log rules using event IDs, which are unique identifiers for particular events. This way, device status and activity can be tracked by OpManager using event logs.
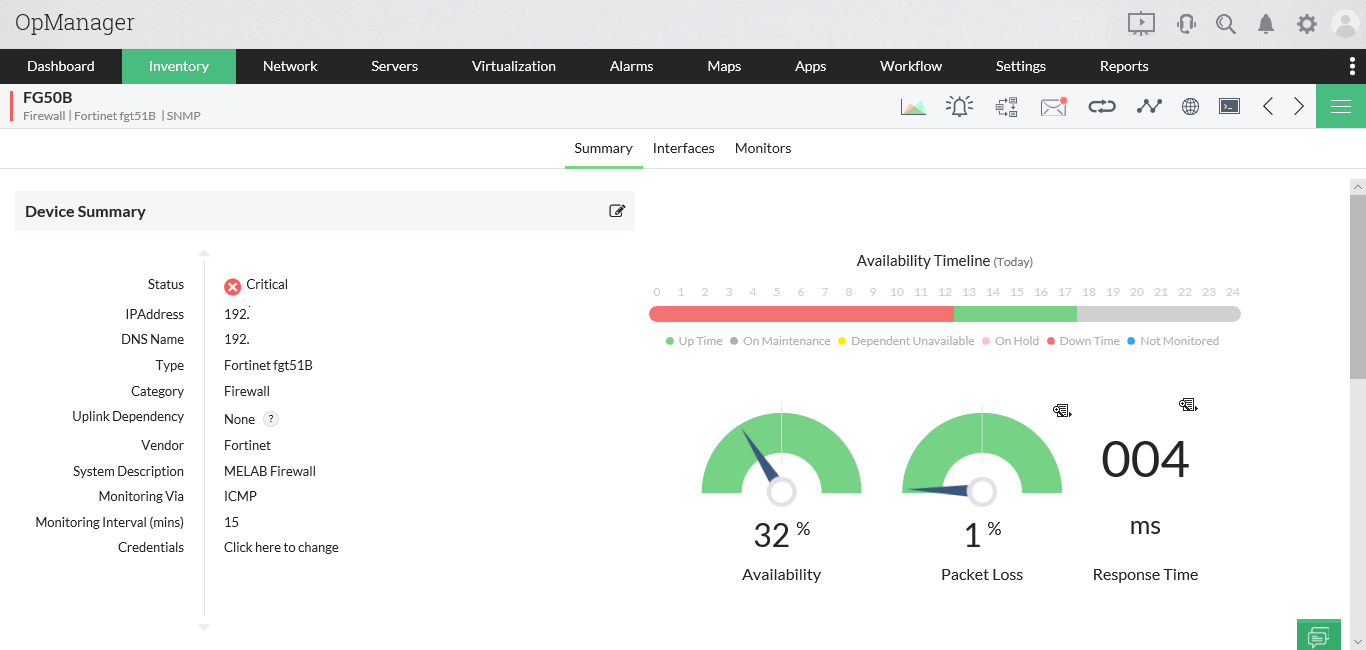
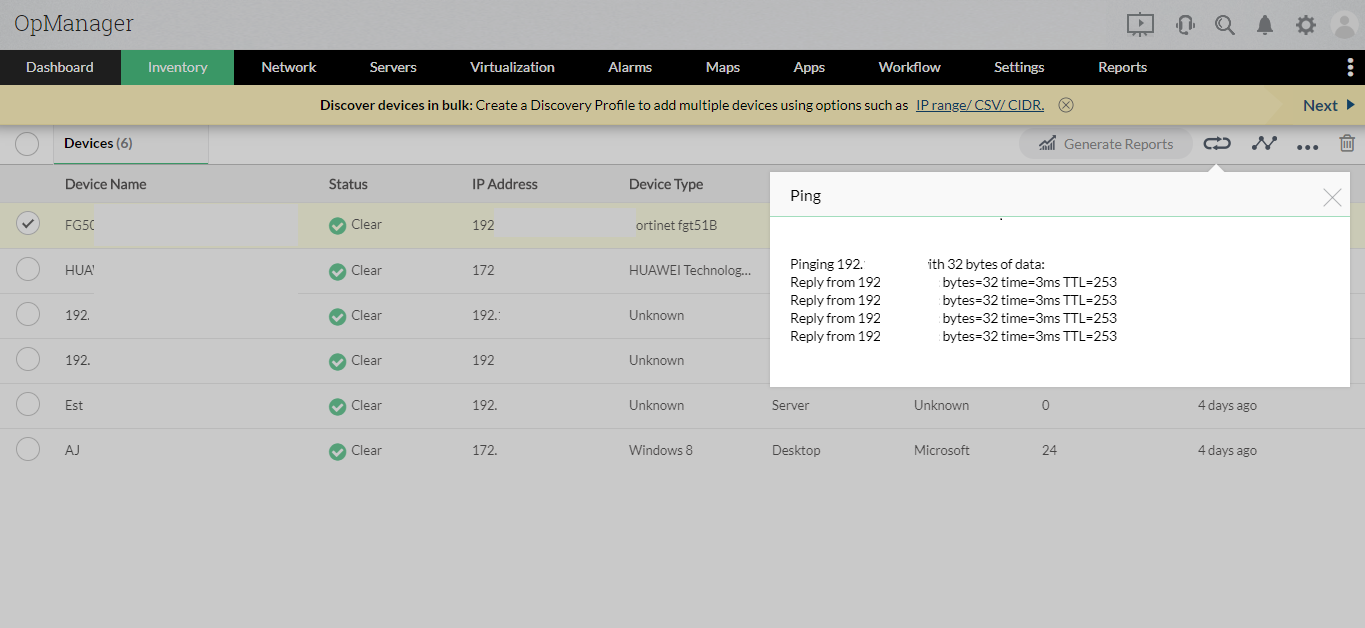
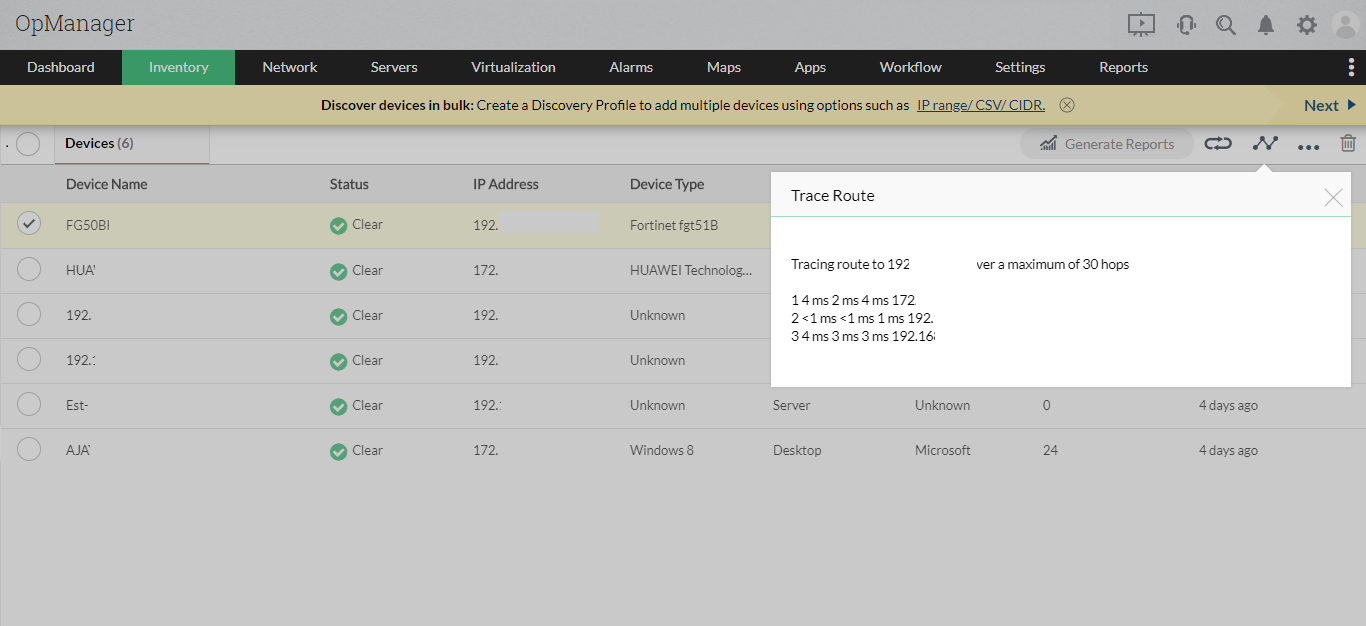
The device inventory is made up of all devices discovered by OpManager. On the Device Summary page, you can find graphs detailing Tx traffic, Rx traffic, and uptime. Ping device and Trace Route are also available to track network activity.

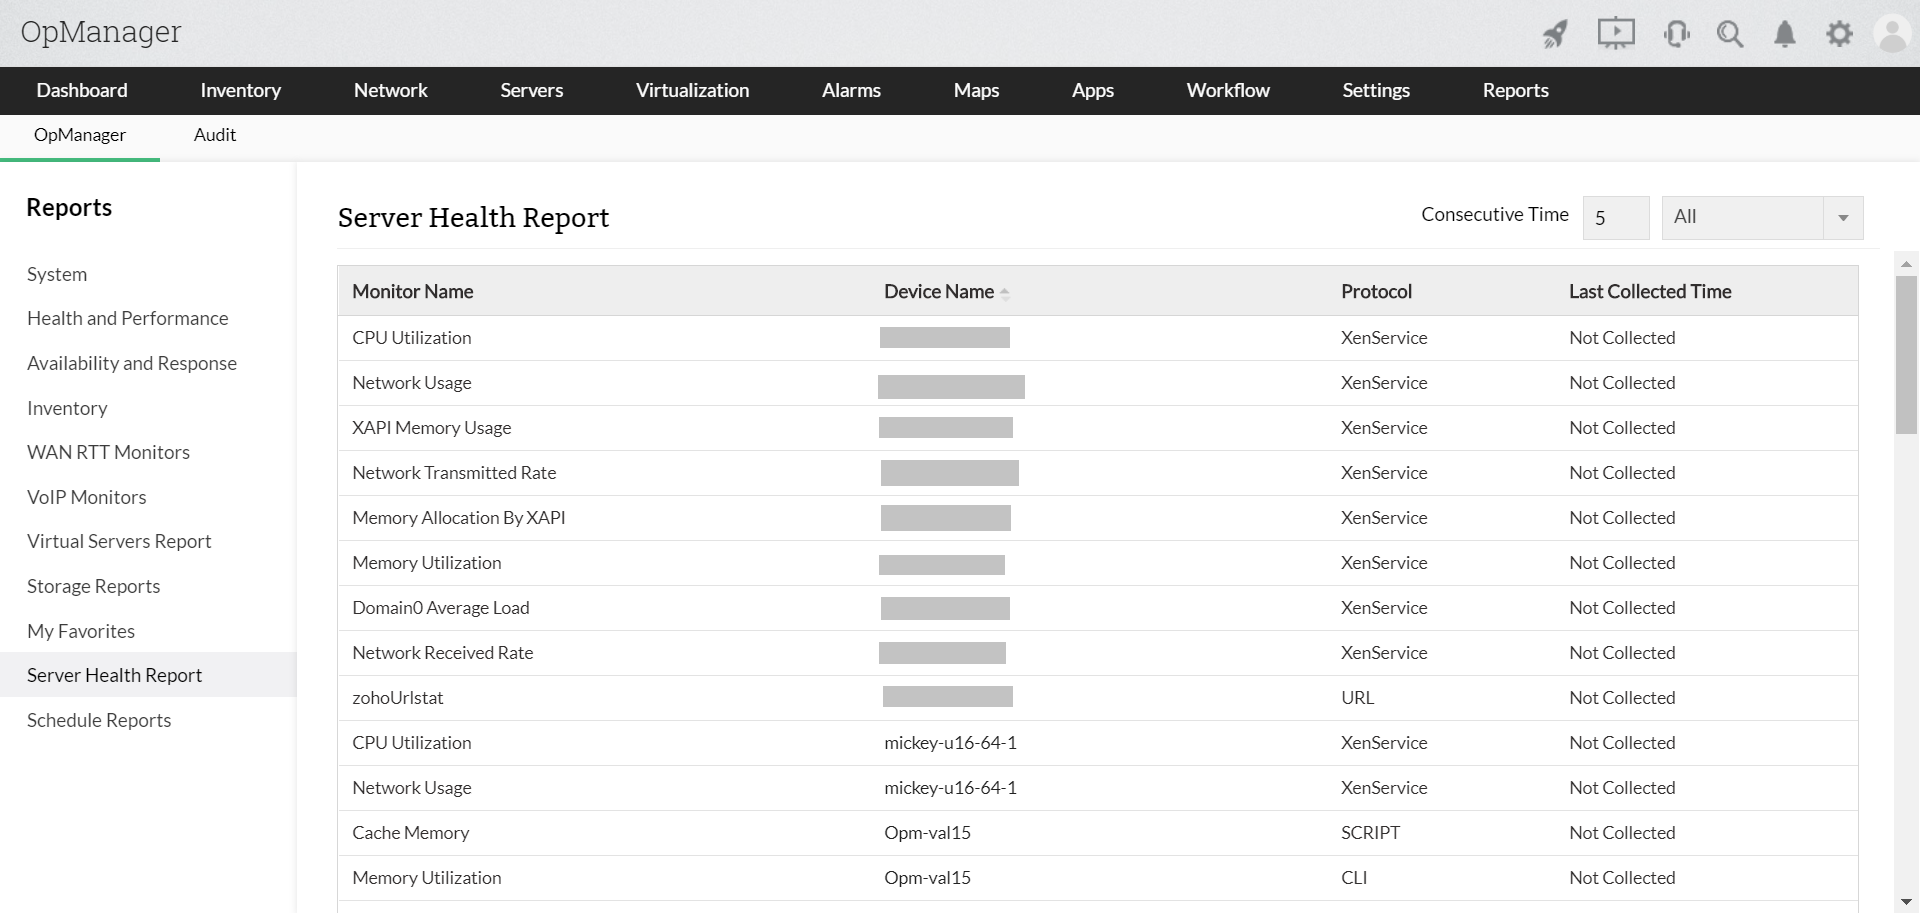
With OpManager, the history of device performance monitoring and downtime statistics can be viewed as real-time or scheduled reports in HTML, JPG, or PDF formats. With these reports, it's easy to analyze network activity and understand network device and bandwidth requirements. With over 100 built-in reporting profiles that can be automatically and periodically sent to mailboxes at the admin's preferred interval, network activity monitoring becomes all the more simple. For more detailed insight on network activity, reports can be generated for a single device in the network, the Business Views of distributed networks of the organization, or device and interface groups.
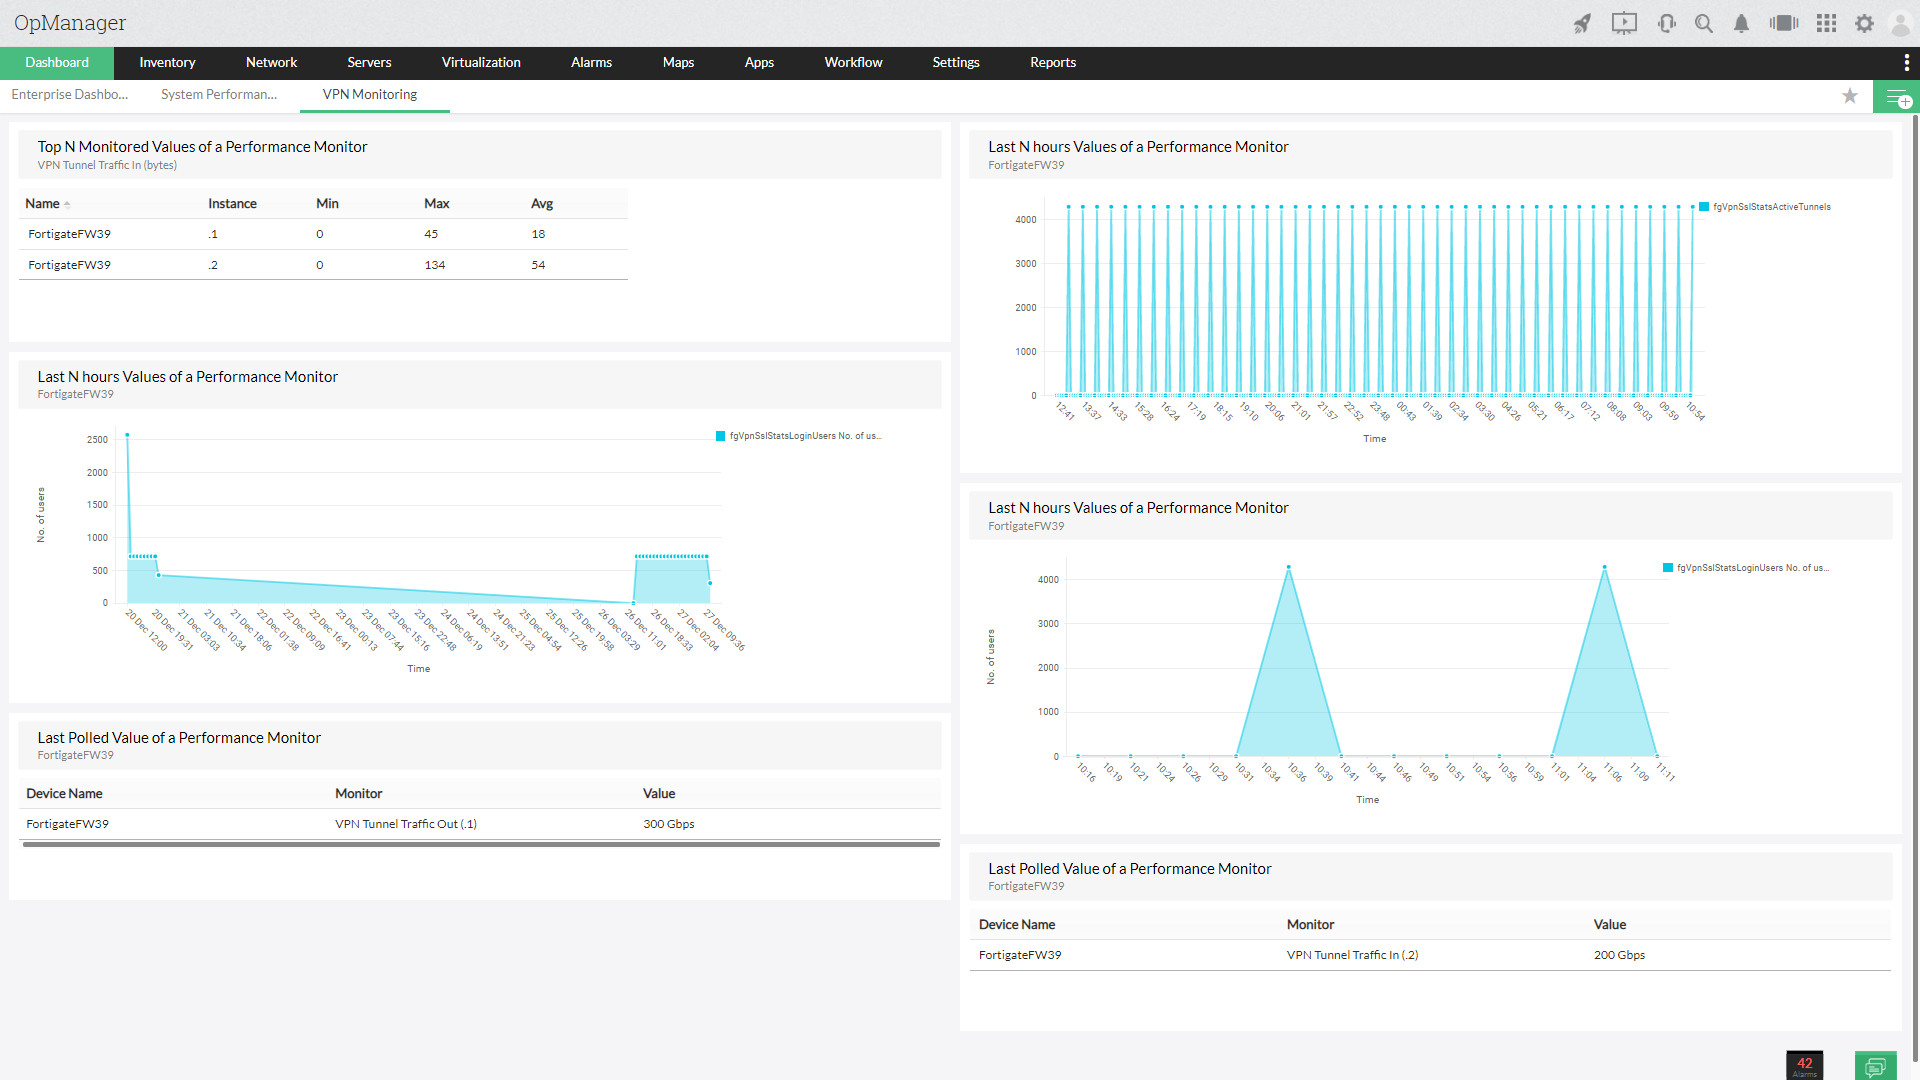
With OpManager's VPN Monitoring feature, IT admins can monitor all their VPN connections from a single console. Additionally, they can monitor the status of VPN tunnels, track the number of active client connections, measure VPN bandwidth utilization, and keep tabs on VPN activity trends.
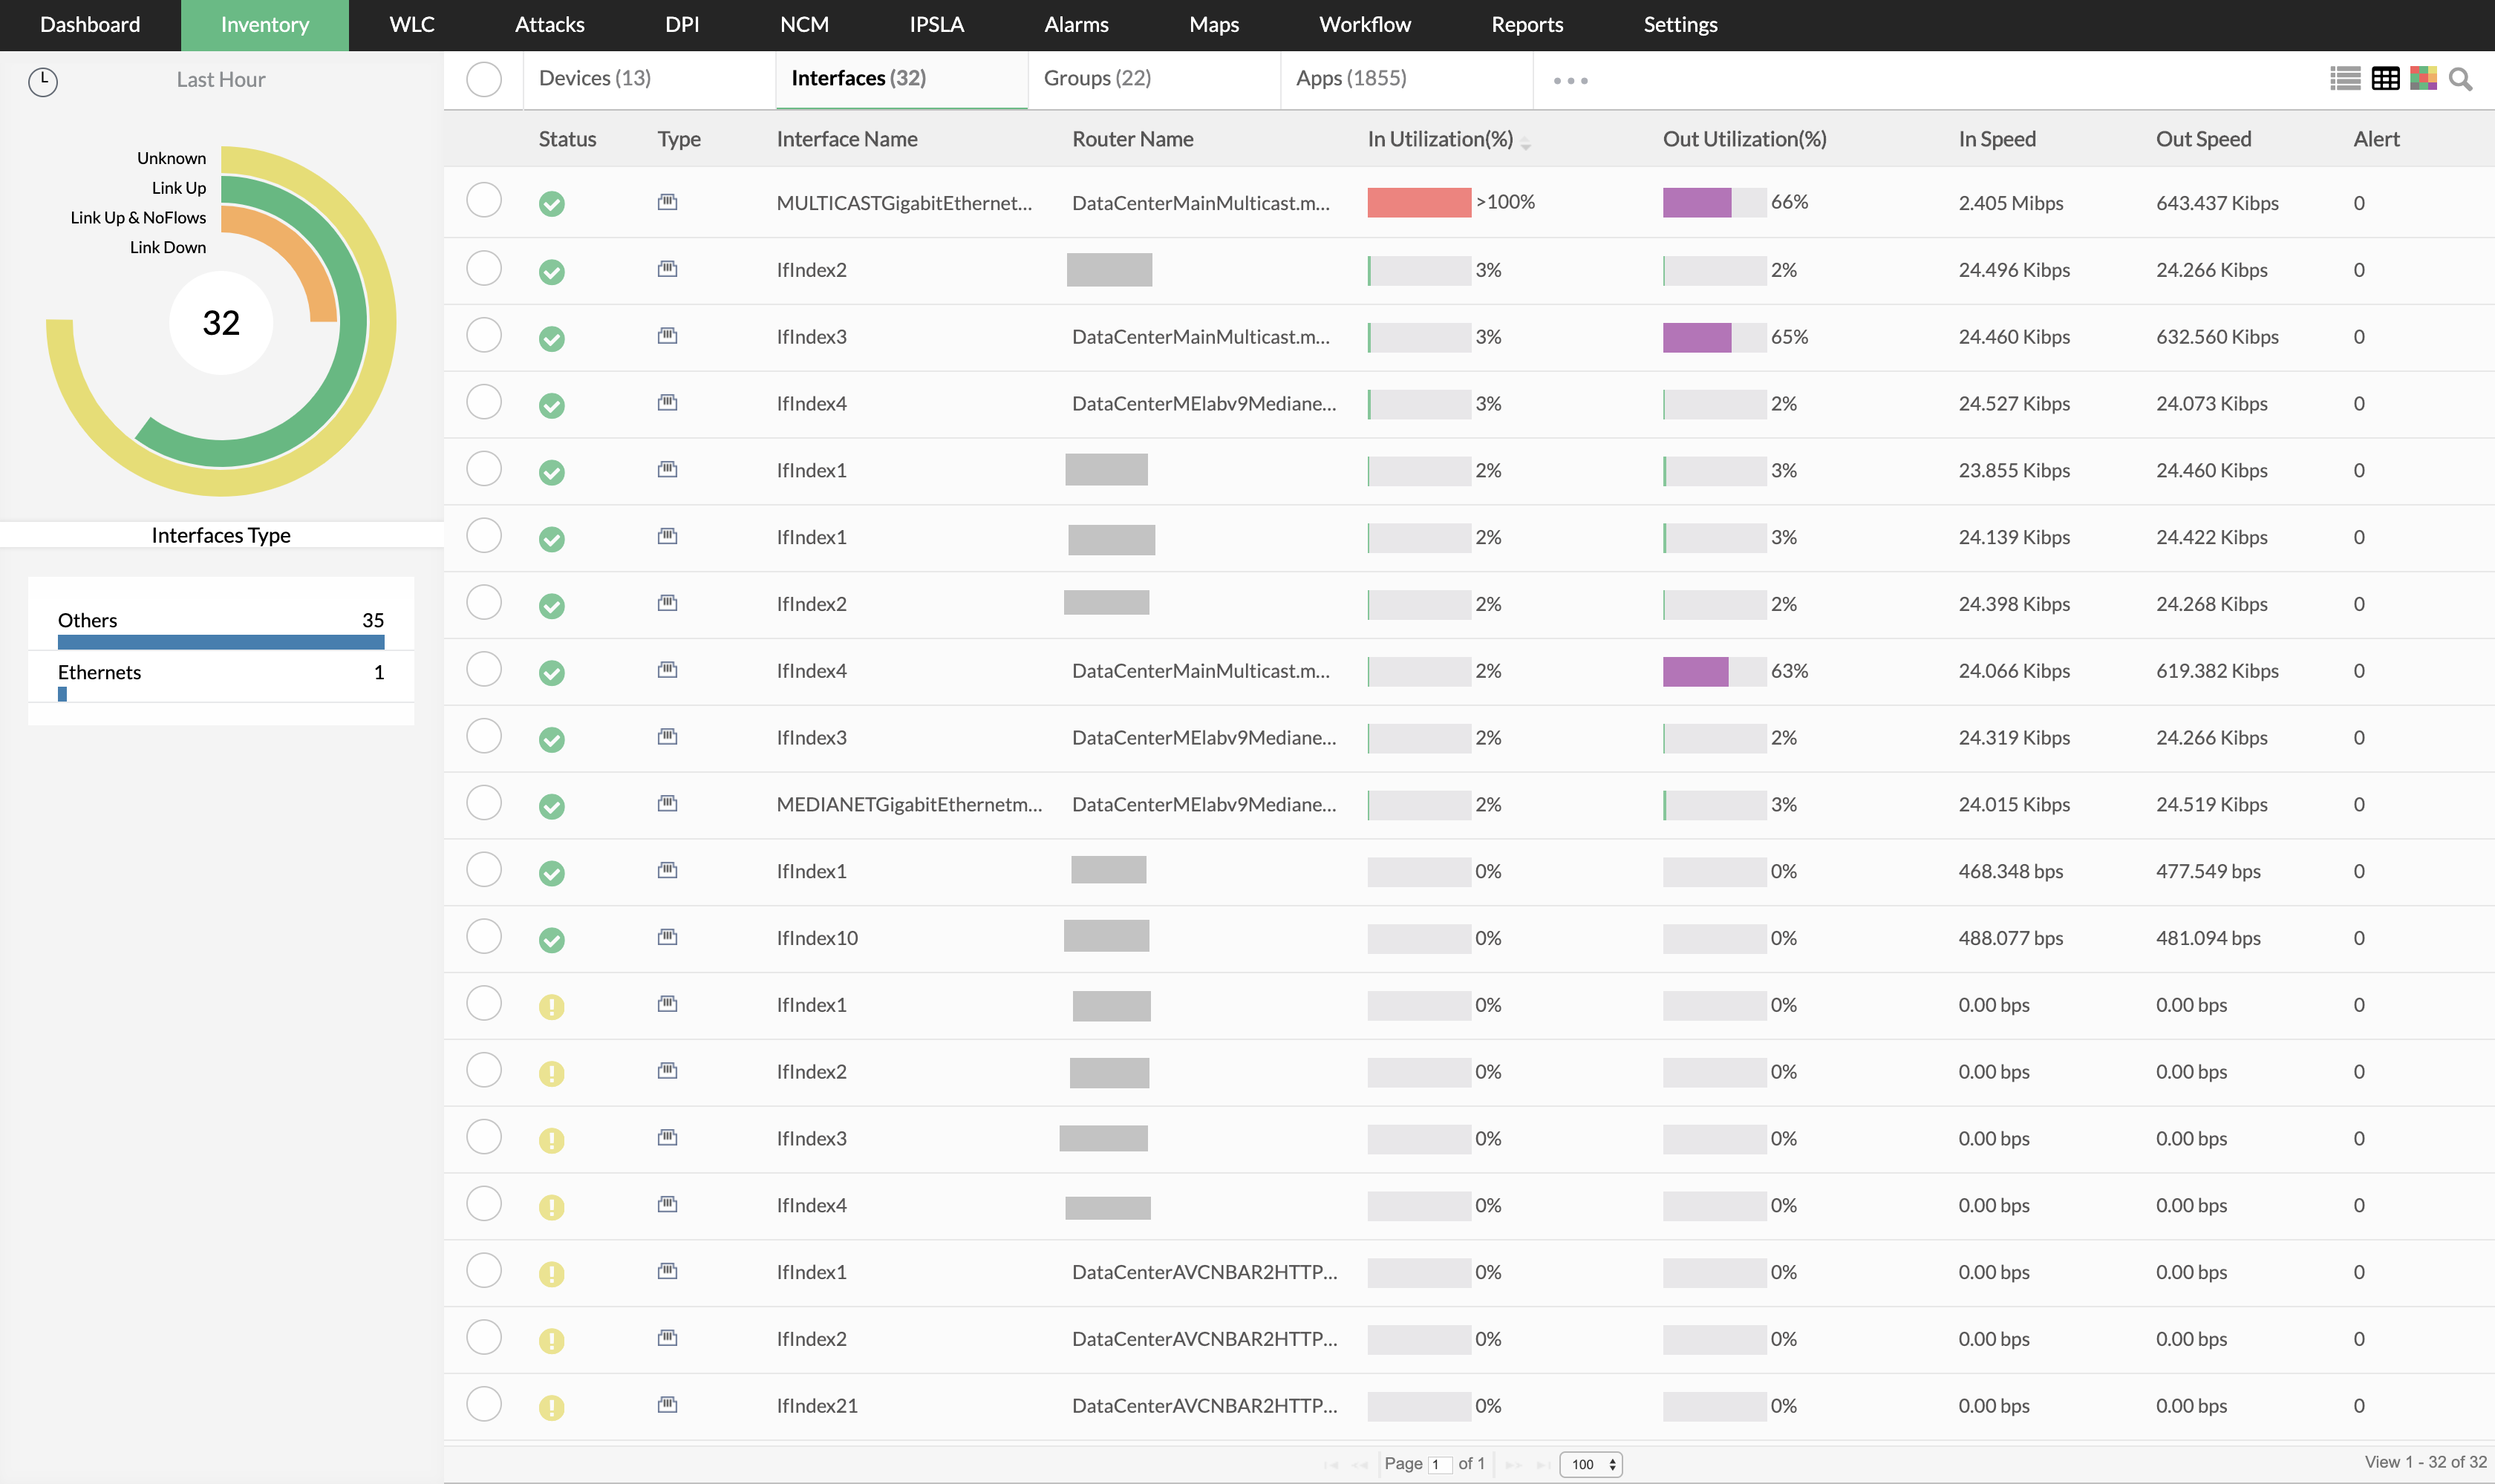
Netflow Analyzer, available as an add-on in OpManager, performs network traffic analysis on flow data and monitors all network activity, such as incoming and outgoing traffic. It monitors and analyzes bandwidth usage trends and traffic patterns; provides traffic information by source, destination, and conversations to help admins understand what exactly is happening in the network; and helps admins decide whether the traffic hitting the network is legitimate or a cyberattack, such as a distributed denial of service (DDoS) attack.
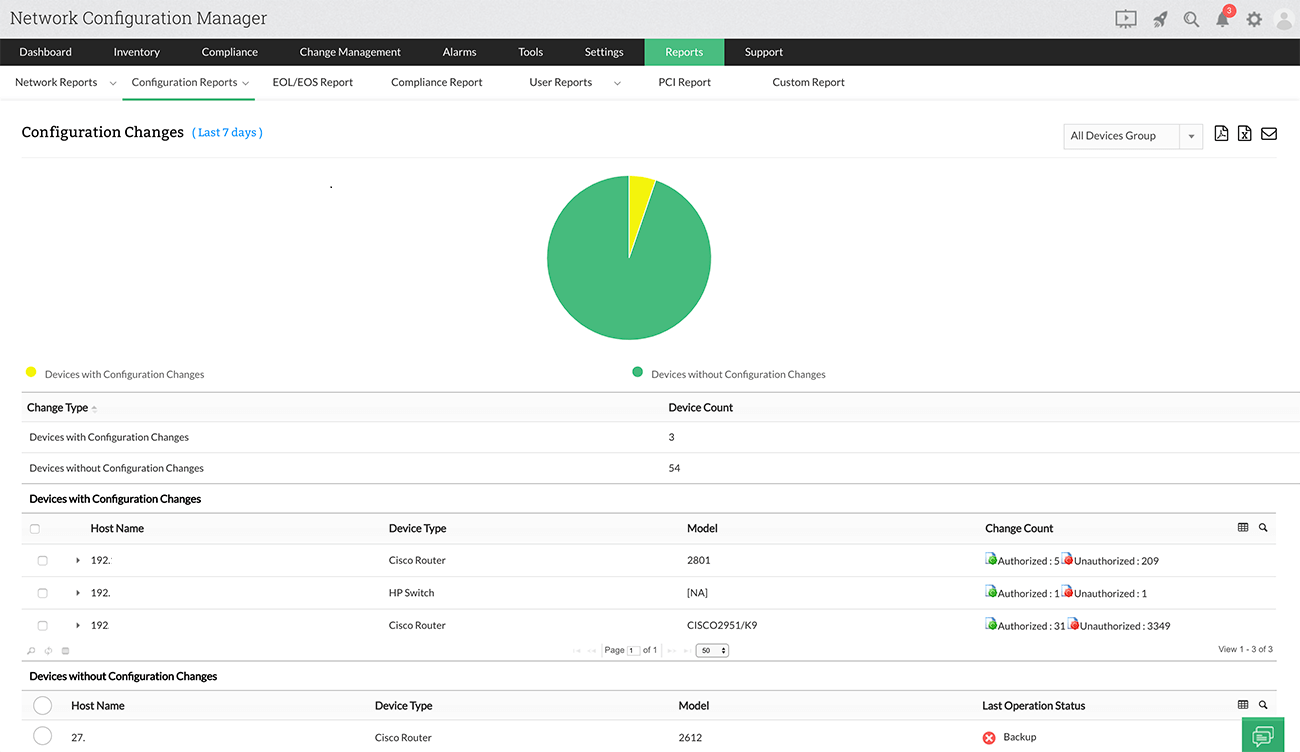
Network admins make frequent network device configuration changes to serve different business needs, and need to maintain a record of all the configuration changes made, when they were made, and who made them. Maintaining a history of configuration changes will help identify the root cause of an issue whenever one pops up. Network Configuration Manager, an add-on within OpManager, helps in tracking change in network activities with configuration backups, compliance management, configuration task automation and execution, configuration reports, and firmware vulnerability management.
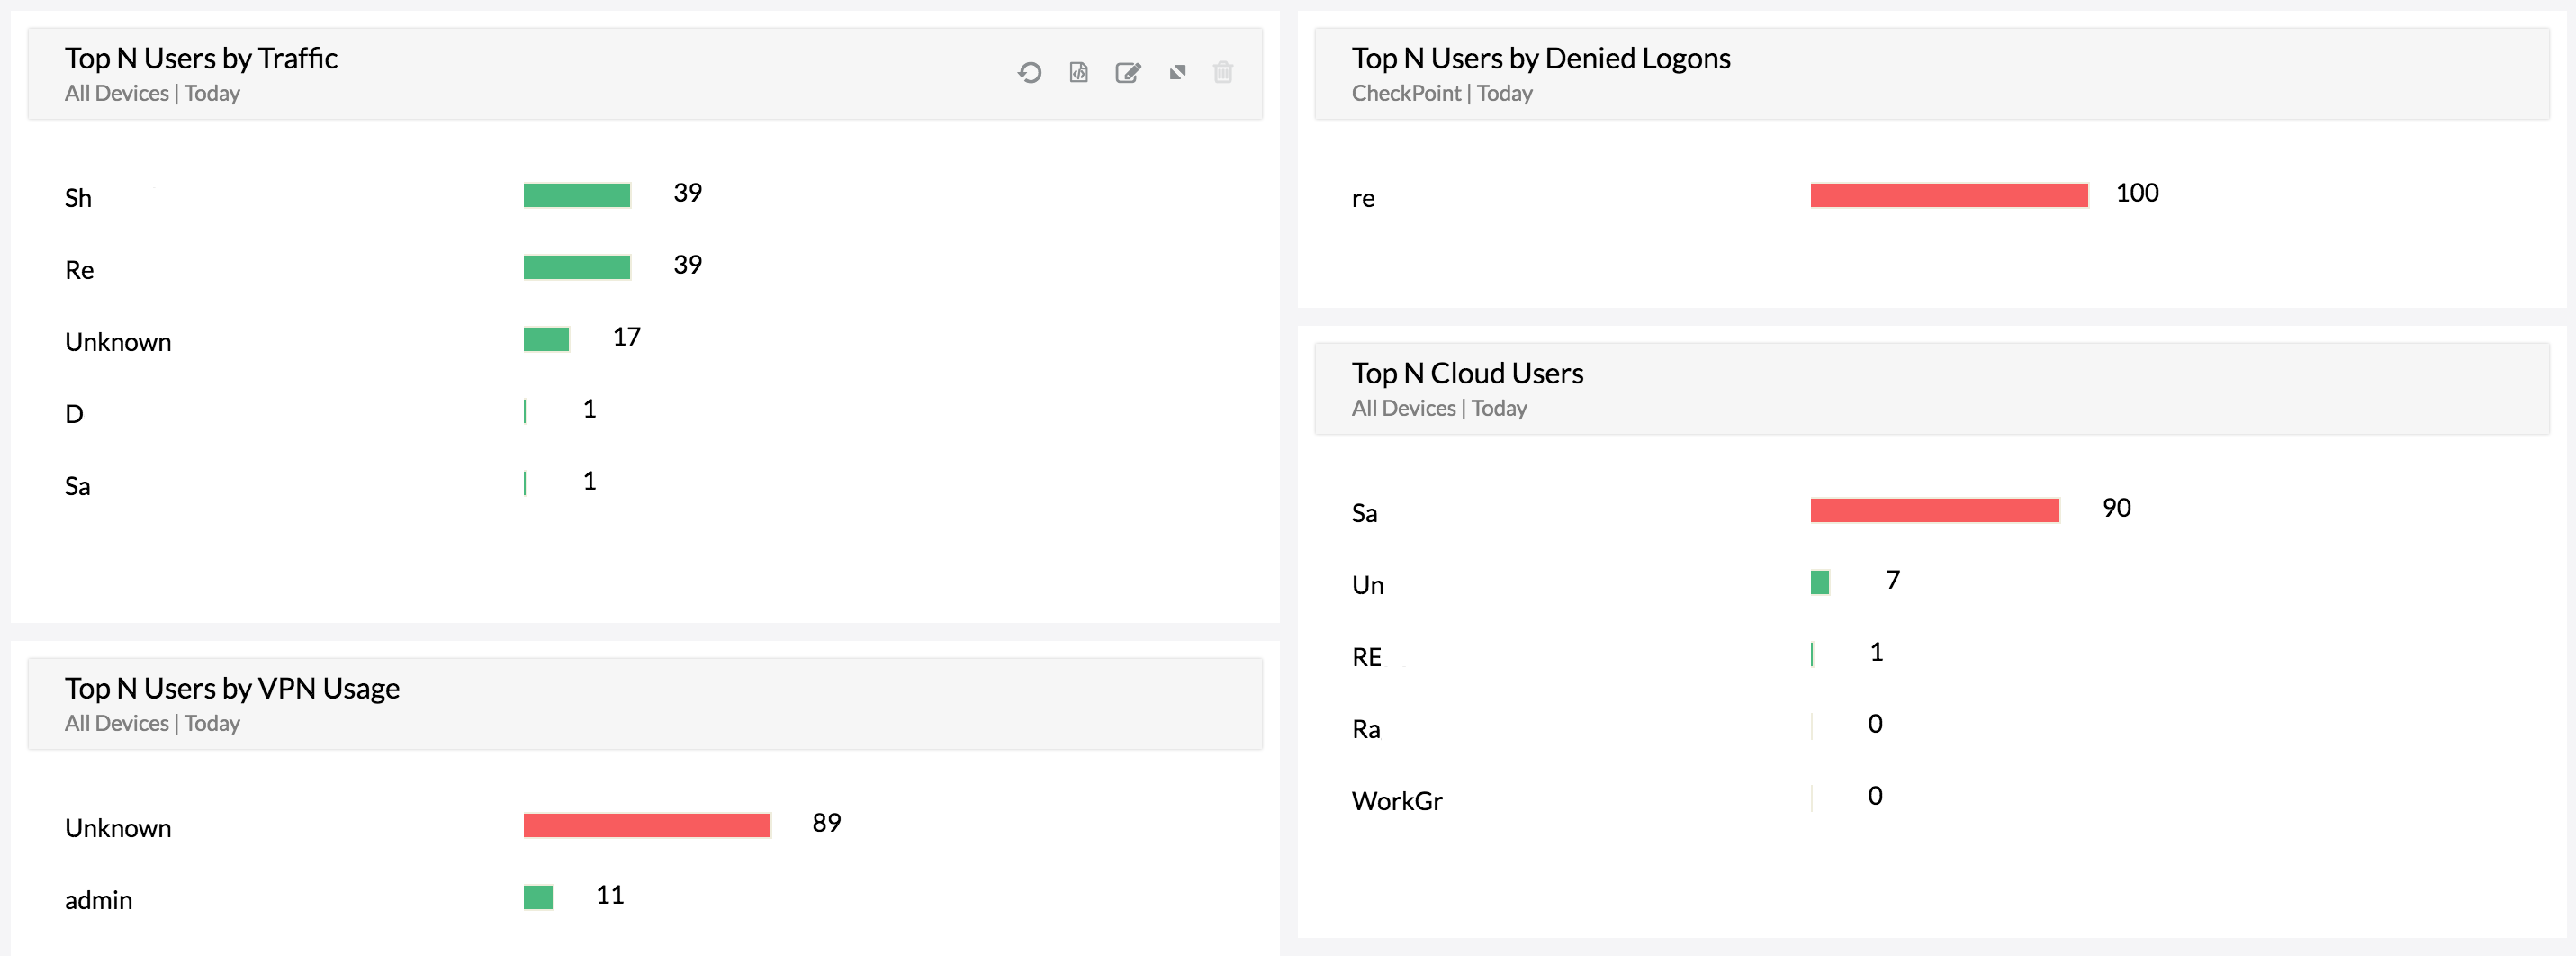
Firewall Analyzer monitors user activity in a network by analyzing user activity logs from the firewall. Firewall Analyzer also provides detailed reports on VPN usage trends, internet bandwidth usage, failed logon attempts, and cloud application usage activity by employees in the organization. Firewall Analyzer is available as an add-on in OpManager.
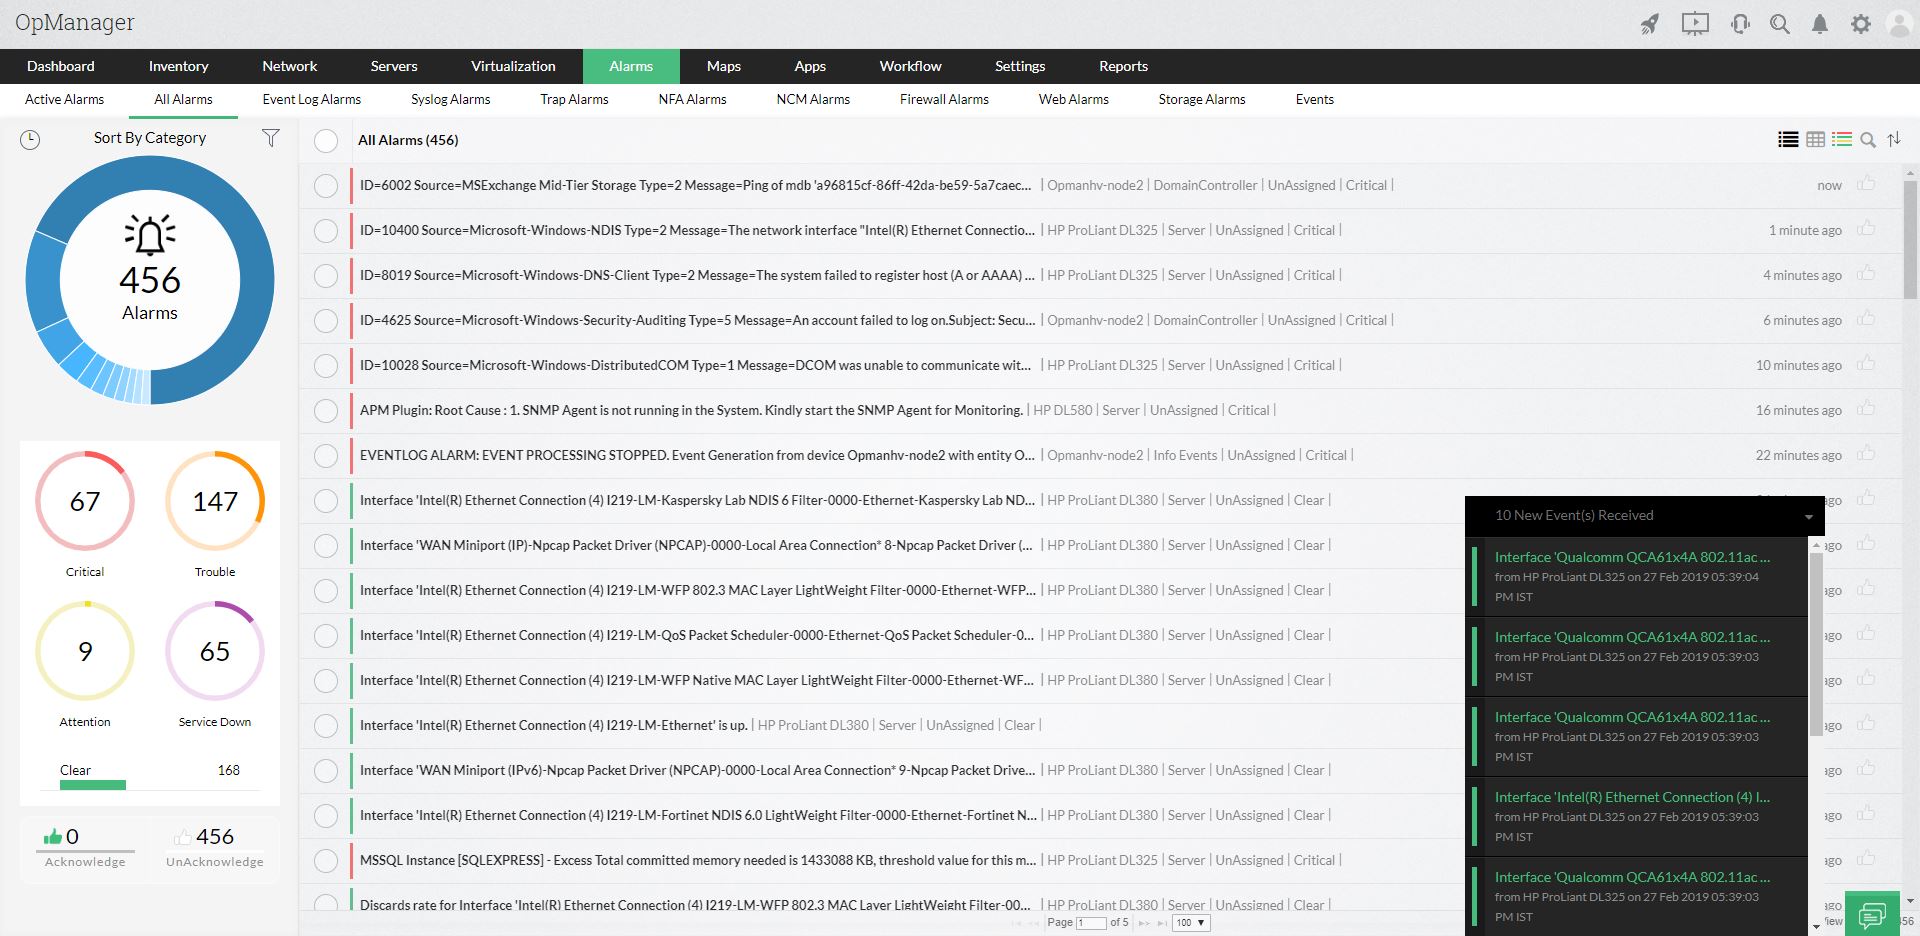
OpManager's report scheduler lets admins compare devices based on any parameter, and export a copy as a shareable document. Moreover, by setting up custom SNMP MIB variables, OpManager enables performance monitoring to be truly vendor independent. OpManager sends alerts via email or SMS; by running a system command or program; by logging a ticket; by raising a web alarm, SysLog, or Trap; by sending Slack notifications; and more. But so many alerts and notifications can sometimes be unnecessary, which is why OpManager classifies them by severity to help IT admins know when and on which alarm they need to take action, priority-wise.
Attention: Low severity
Trouble: Medium severity
Critical: High severity
Service down: Non-responsive device
Rearm: To reset the alerting condition after it has been triggered
OpManager offers a highly custom, role-based dashboard that tracks the parameters IT admins deem necessary. Admins can drag and drop widgets to get a birds-eye view of all network activity; if anything suspicious is detected, they can drill down to identify the source. Using OpManager, admins can gain visibility into each device's health, uptime, and availability graphs and reports, all on an easy-to-understand dashboard.
