With the innovation of virtual server infrastructure, businesses are looking to adopt more virtual devices into their network - thanks to the freedom these devices provide with respect to monitoring, maintenance, and scalability. Virtual Machines (VMs) pave the way to a more flexible, robust, and adaptable network infrastructure that can help businesses expand in ways previously unheard of.
With VMware dominating the virtual machine and virtual server industry, most businesses looking for virtual infrastructure choose VMware as their go-to vendor. If your business is churning the network on a day-to-day basis, you will need a vSphere monitoring or VMware ESXi monitoring software. From simple implementations that include just a host and a few VMs to entire virtual networks that connect locations several thousand miles away, VMware solutions offer a great deal of scalability and reliability for your networks.
With the implementation of any network resources, there arises a need to also monitor and manage them, and VMware resources are no exception. ManageEngine OpManager serves as a highly efficient VMware ESXi monitoring tool for your network and enables you to proactively manage and monitor VMware ESXi hosts in real-time. This comprehensive ESX monitoring software enables you to,
To begin with, OpManager's ESX SNMP monitoring offers easy discovery of your ESXi hosts and the VMs under them from a discovery module, with which you can add them all into OpManager in a single click. Once you're done with the discovery, you can start monitoring ESXi hosts right away. Critical ESXi host metrics and statistics of your VMware are monitored in real-time, and you can learn the status of your virtual servers and VMs right away. By default, OpManager uses VMware API to fetch and display data on important performance metrics from your VMware ESXi hosts enabling you to perform real-time VMware ESXi performance monitoring.
During discovery, a predefined set of monitors is associated with your VMware resources and can be viewed from the Monitors tab of your ESXi host's device snapshot page. The data is fetched from the VMware ESXi monitor at a user-defined interval, and you can also see the timestamp of the latest version of polled data to more accurately see how recently the data has been collected.
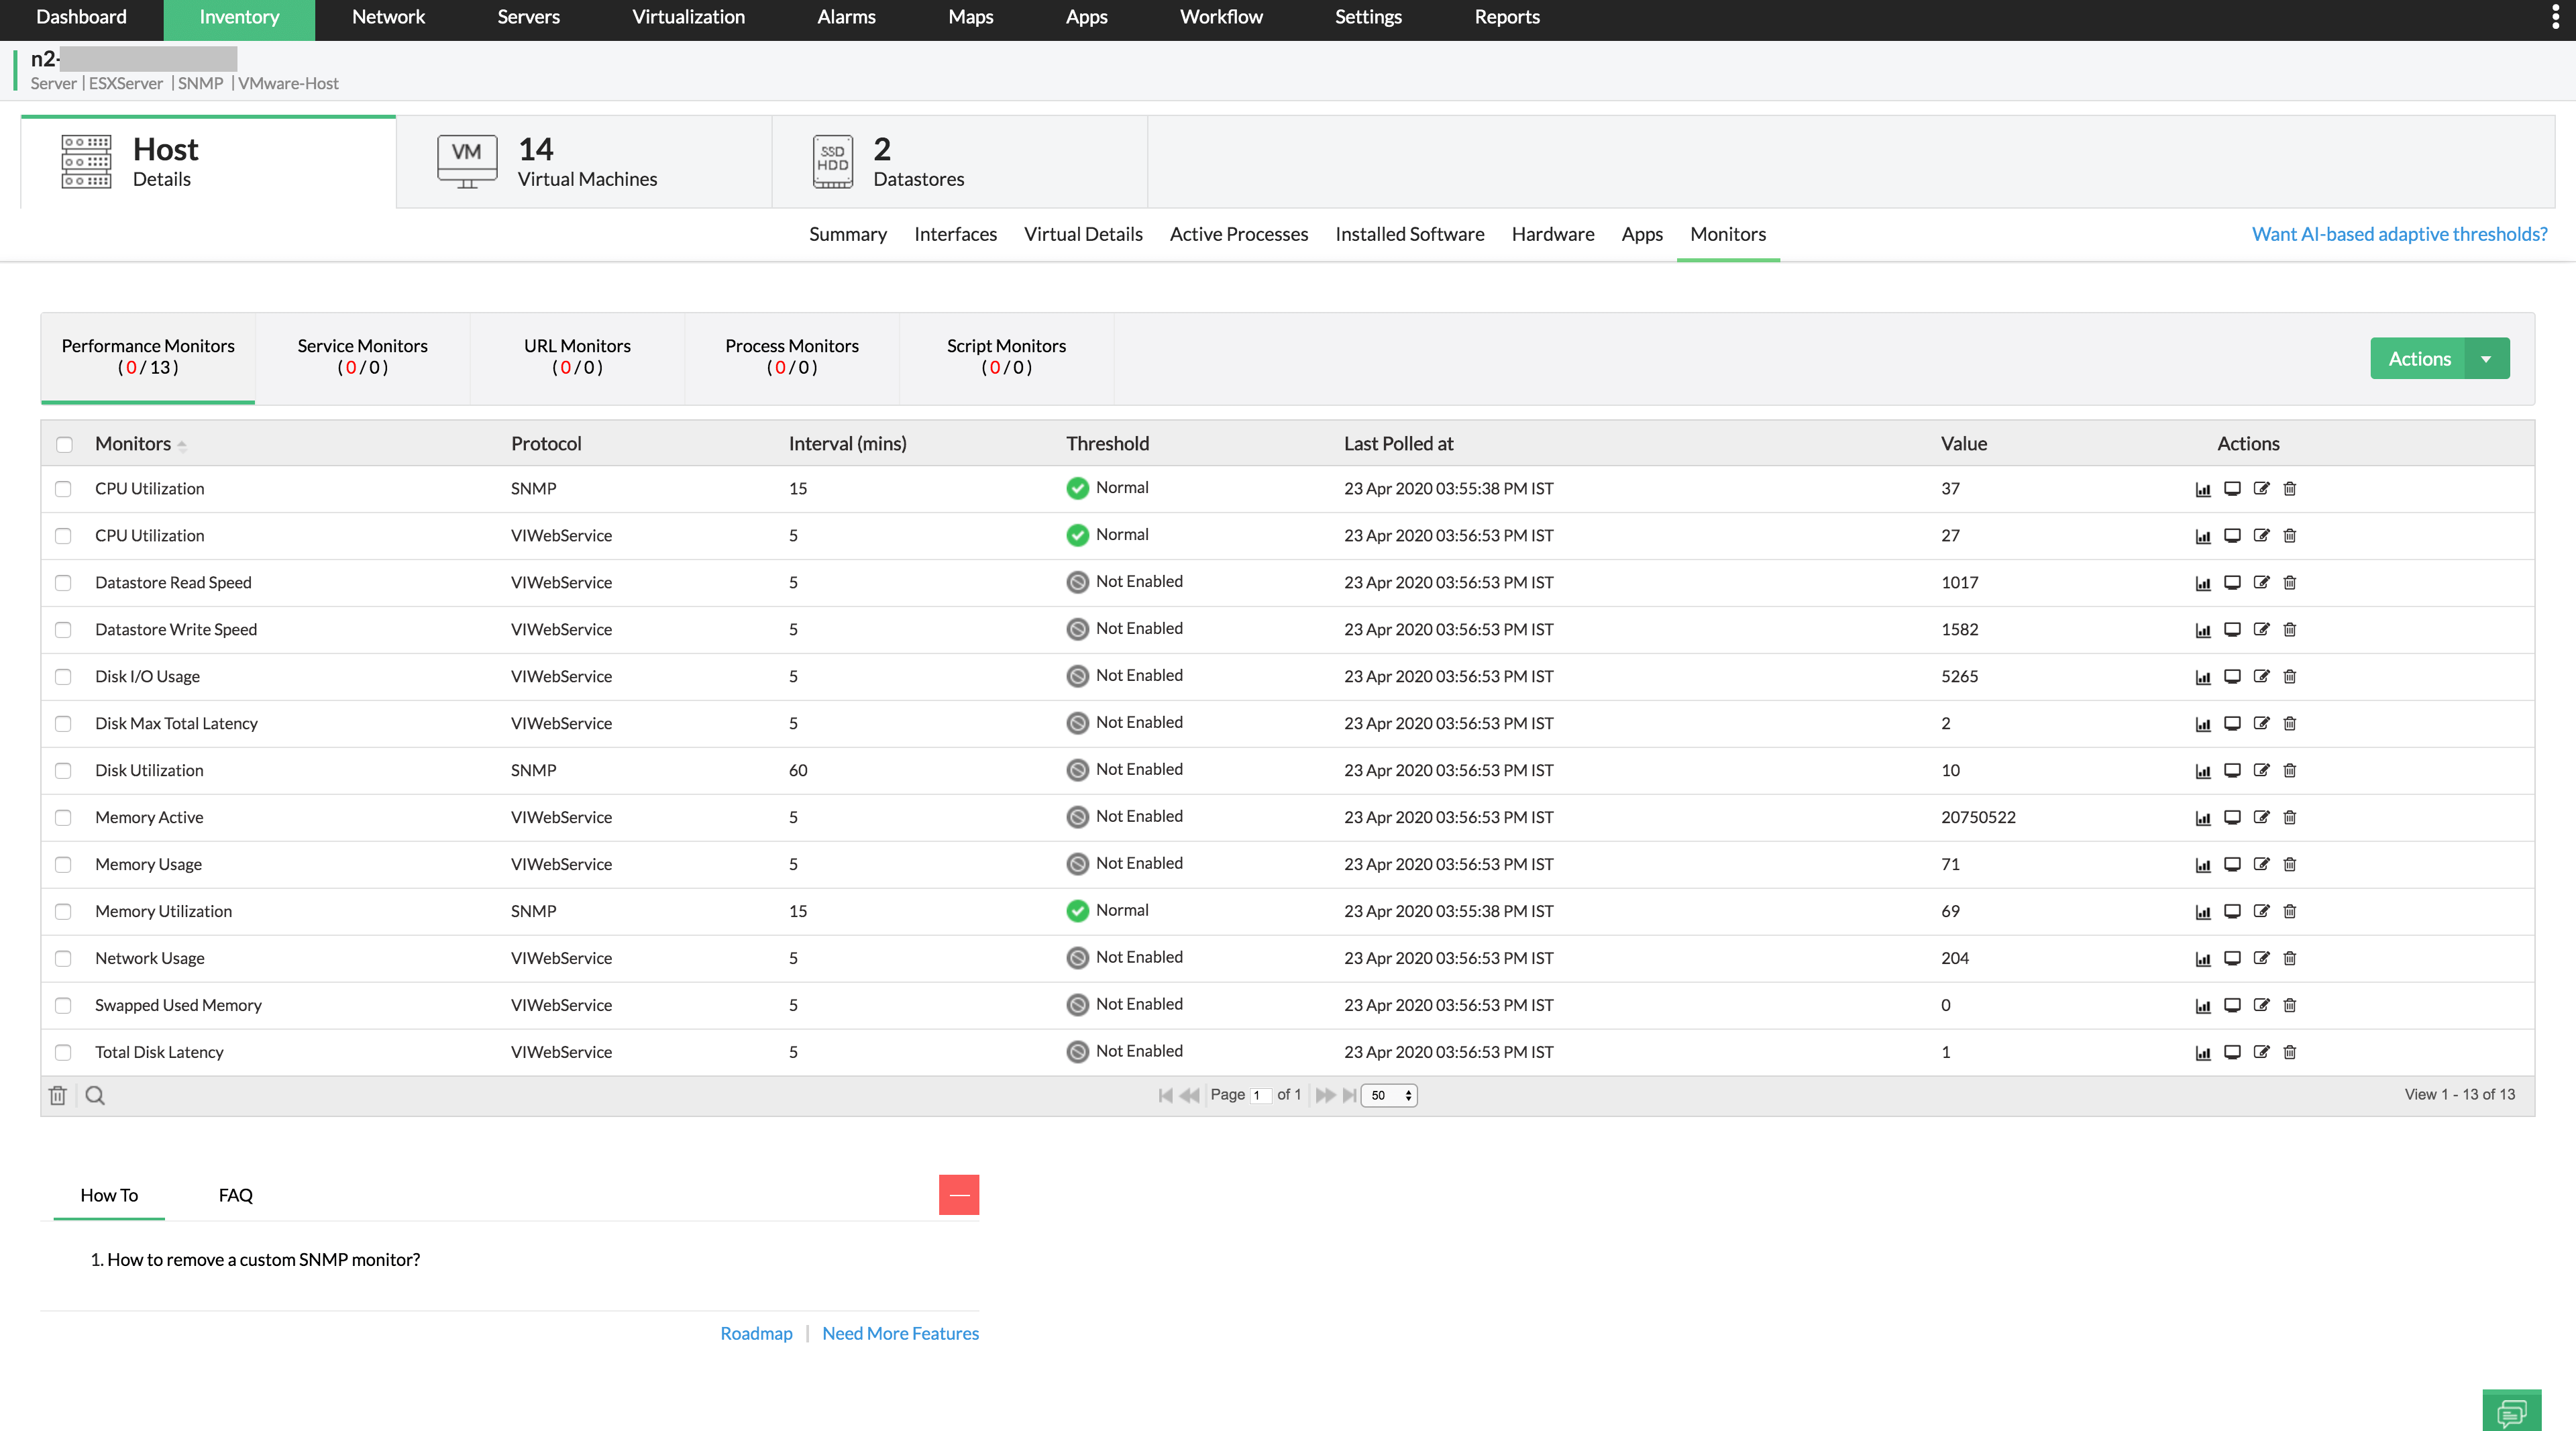
Even though VMware API can fetch a considerable number of critical metrics on ESXi host and VM performance, you may want to monitor your VMs more intensively on device-specific metrics. OpManager's ESXi monitoring tools allow you to monitor your VMs based on other protocols, such as the Simple Network Management Protocol (SNMP), Windows Management Instrumentation (WMI), and command-line interface (CLI) so you can also fetch device-specific performance metrics of your VMware VMs. This enables you to monitor more server-related metrics using VMware ESXi SNMP Monitoring.
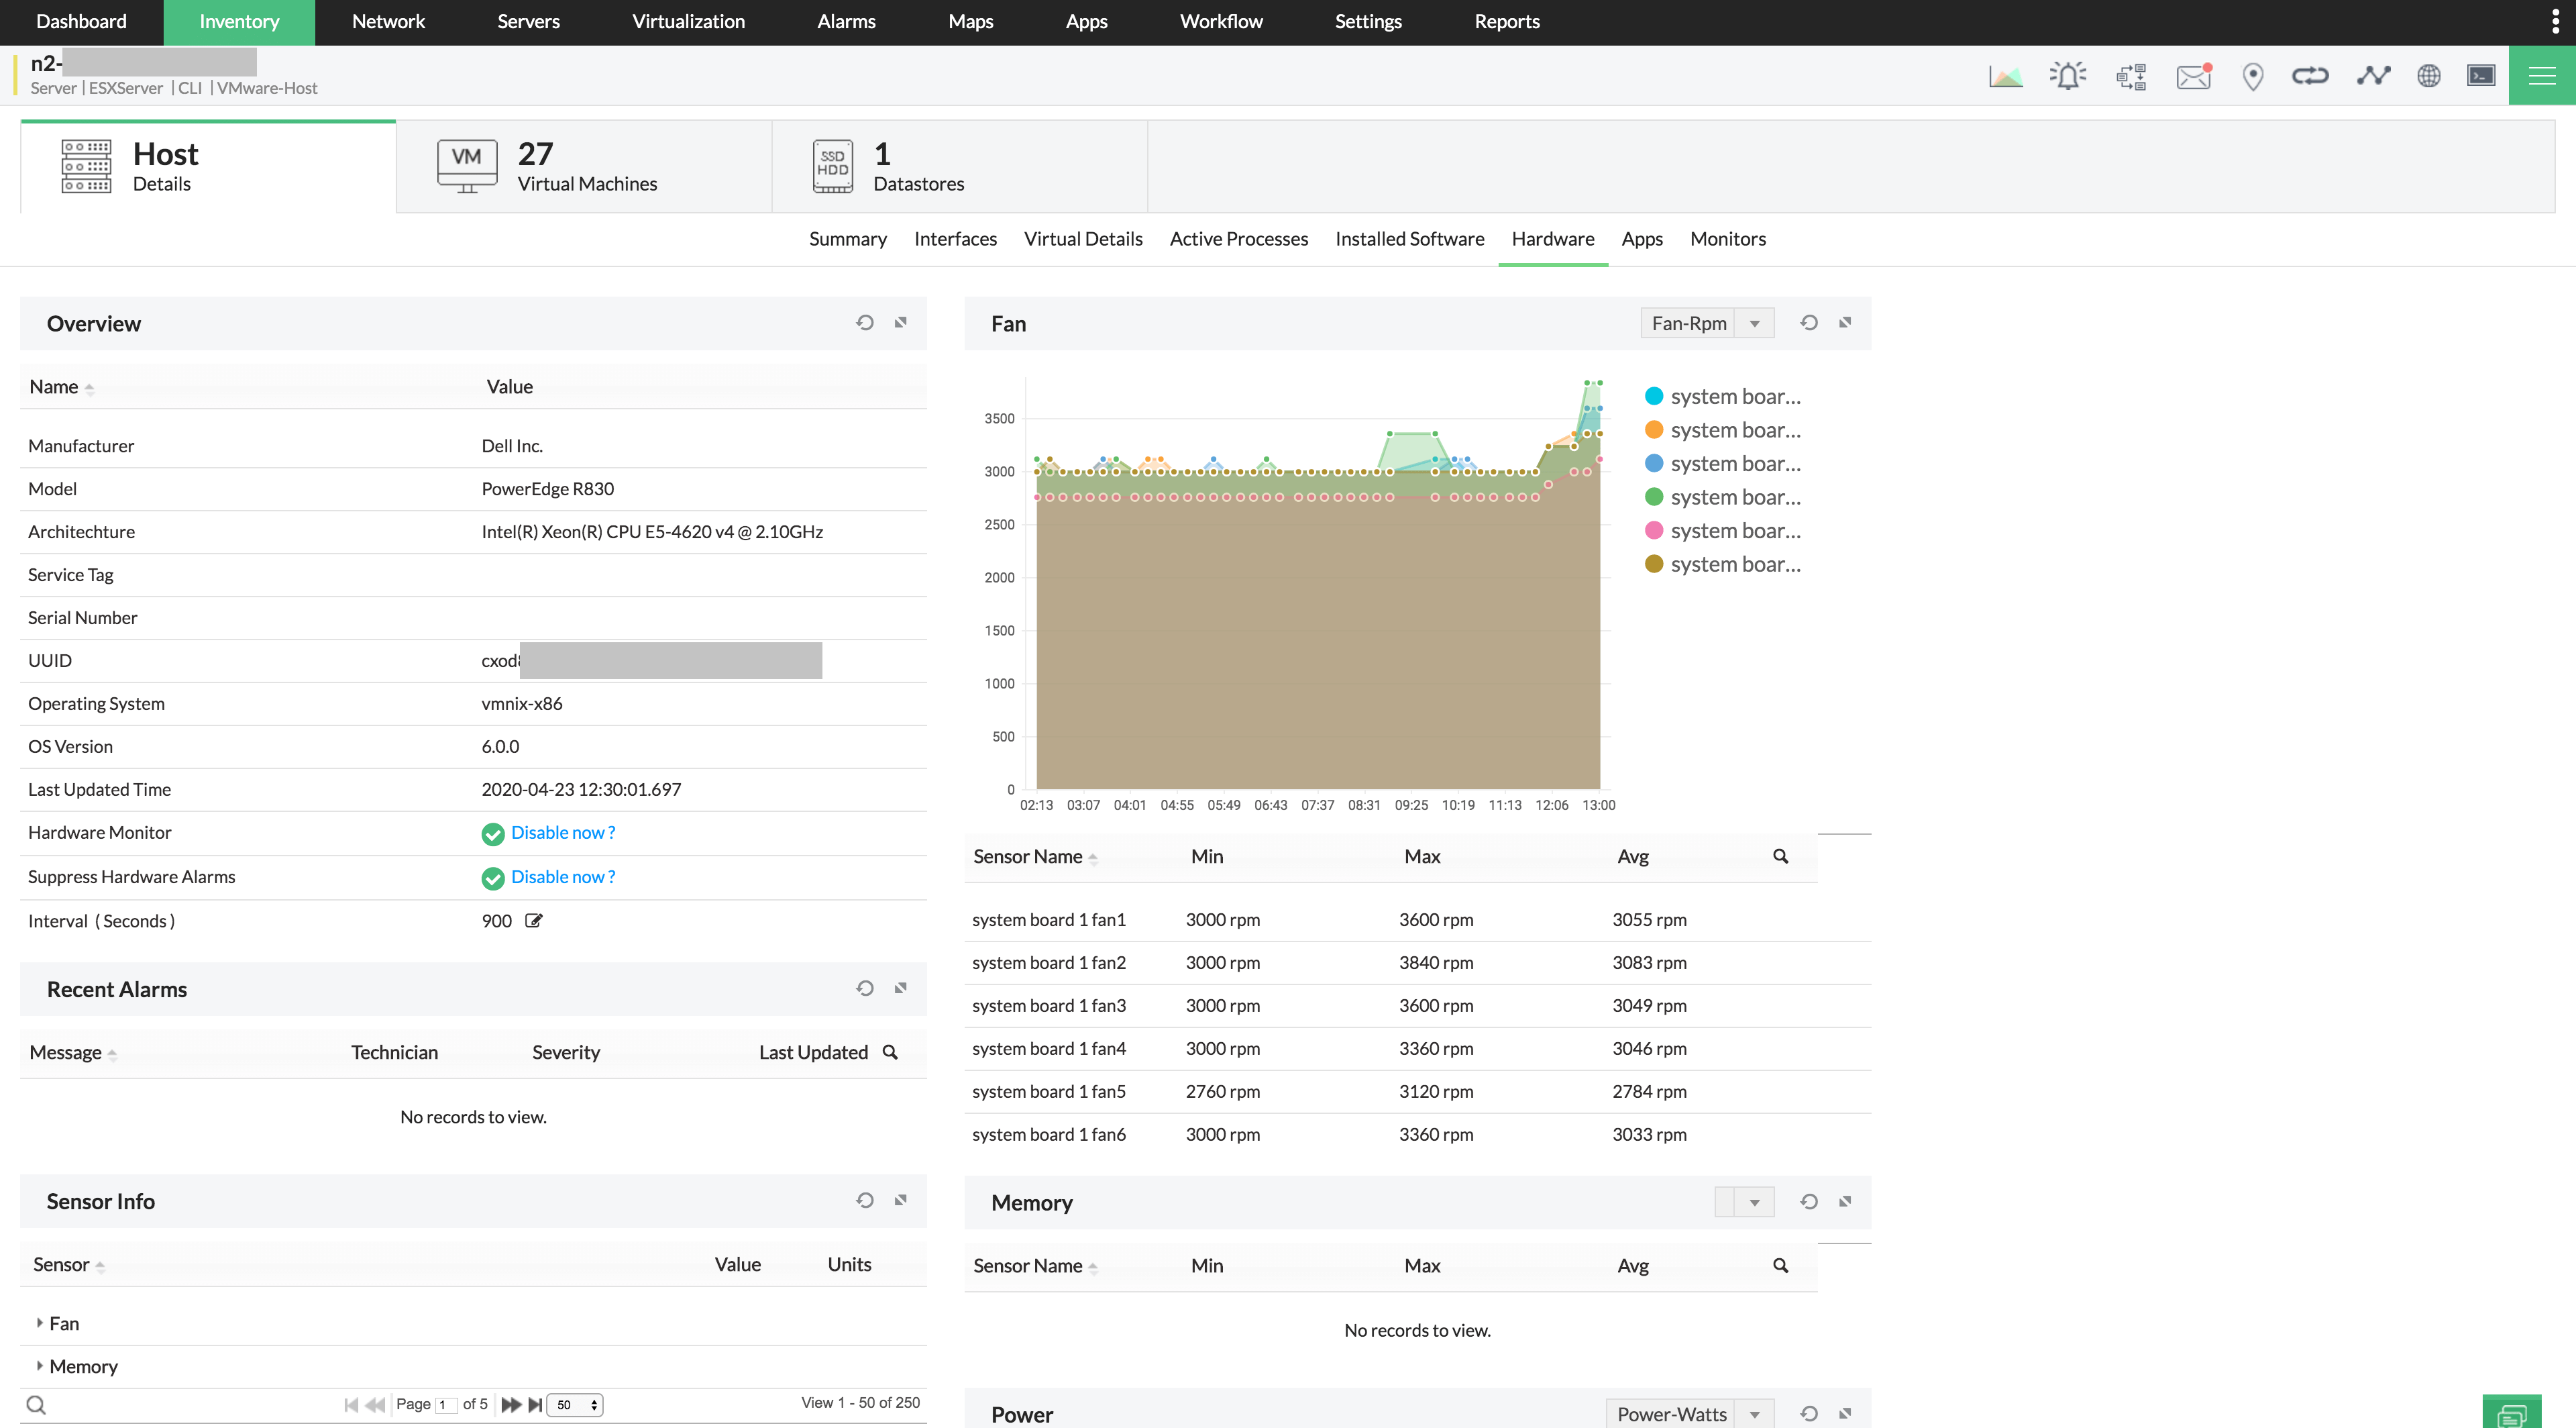
OpManager also enables you to monitor ESXi host-related hardware metrics in real, so you can effectively identify and resolve hardware-related performance issues in your VMware devices. A dedicated tab for hardware monitoring is displayed on the Device Snapshot page of your ESXi host, where you can find all hardware metrics and their current status. Hardware metrics down to sensor info like temperature, CPU used, and memory used can be monitored from here, allowing you to monitor VMware ESXi performance holistically.
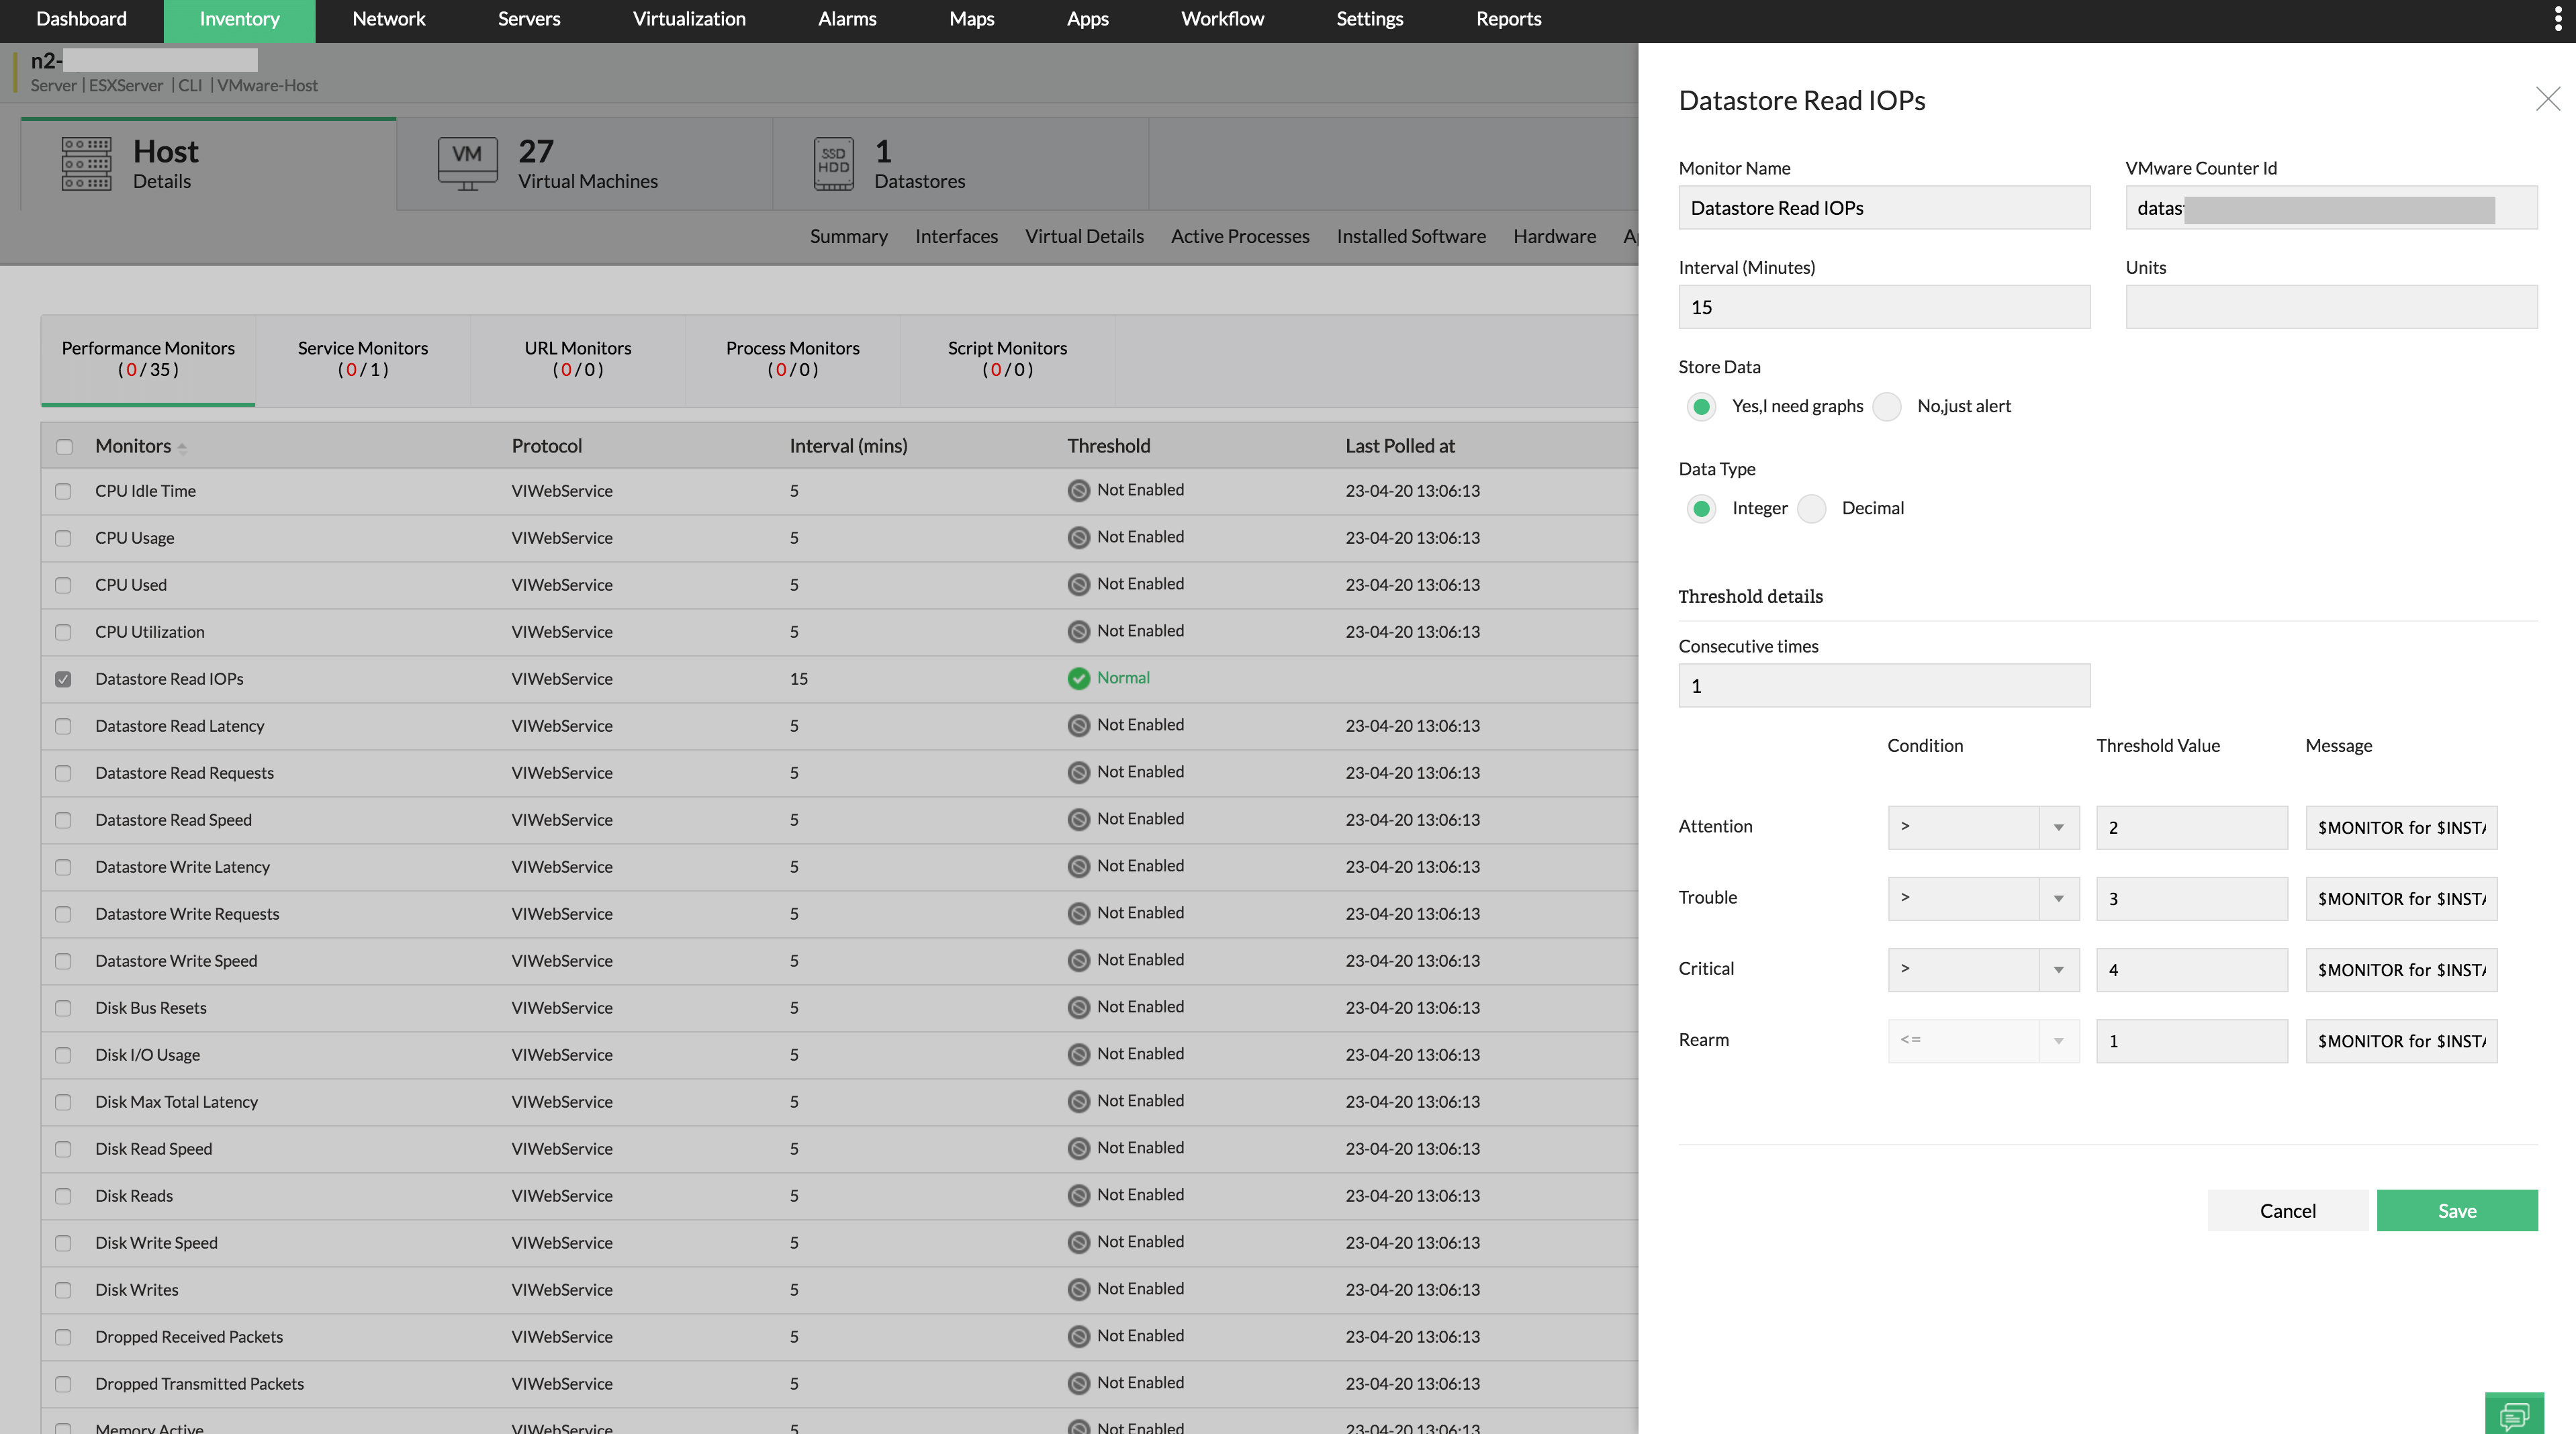
Being an efficient VMware ESXi monitoring software, OpManager allows you to set thresholds for the performance metrics that are monitored in your VMware ESXi hosts. This way, when the performance of your ESXi server deteriorates, you'll be instantly notified through OpManager web alarms in the user interface, and you can perform corrective measures to ensure your ESXi server is back on track.
You can set thresholds to raise alerts based on three priorities: Attention, Trouble, and Critical. Moreover, OpManager provides an additional Rearm threshold so you can clearly define when you want a particular threshold alarm to be reset.
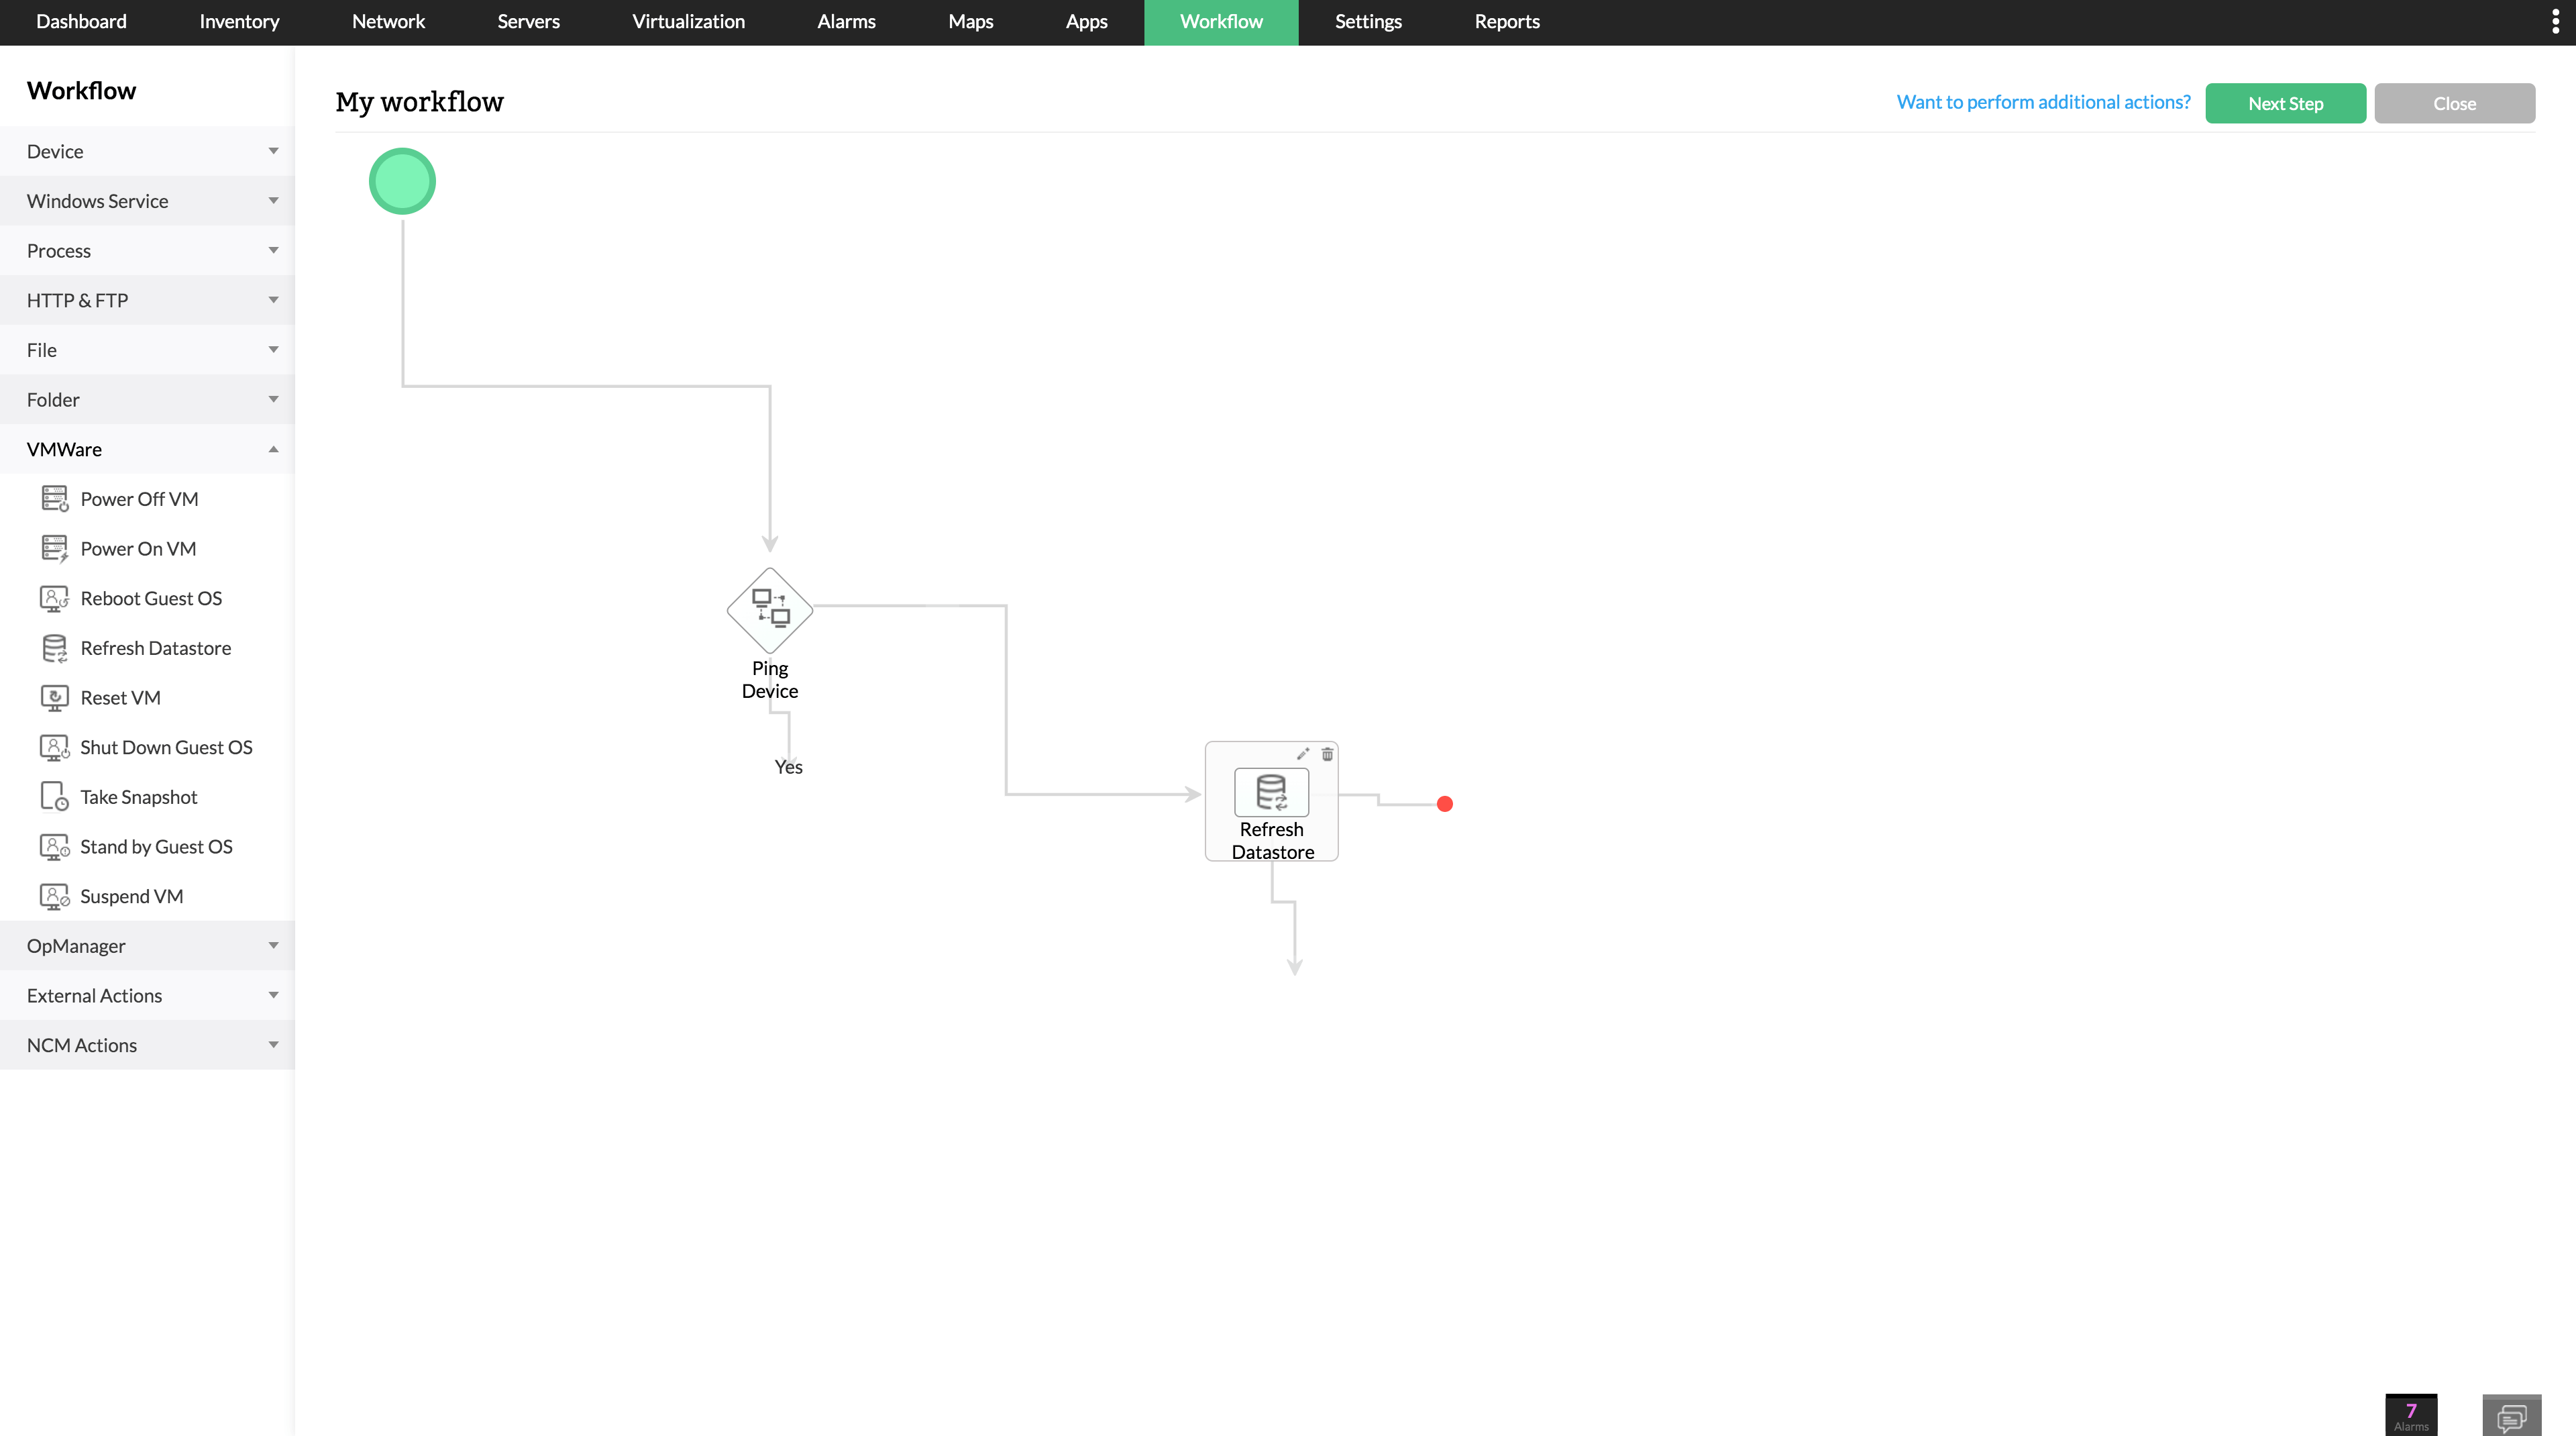
OpManager as an ESXi monitoring tool tries to reduce human intervention in resolving VMWare ESXi performance issues by using Workflows. With this feature, you can set actions to be performed in your ESXi hosts when select triggers are recorded in the network. The trigger can be anything from an alarm to a process not responding, and an array of actions can be performed on the VMware resources, including powering on/off VMs and suspending VMs.
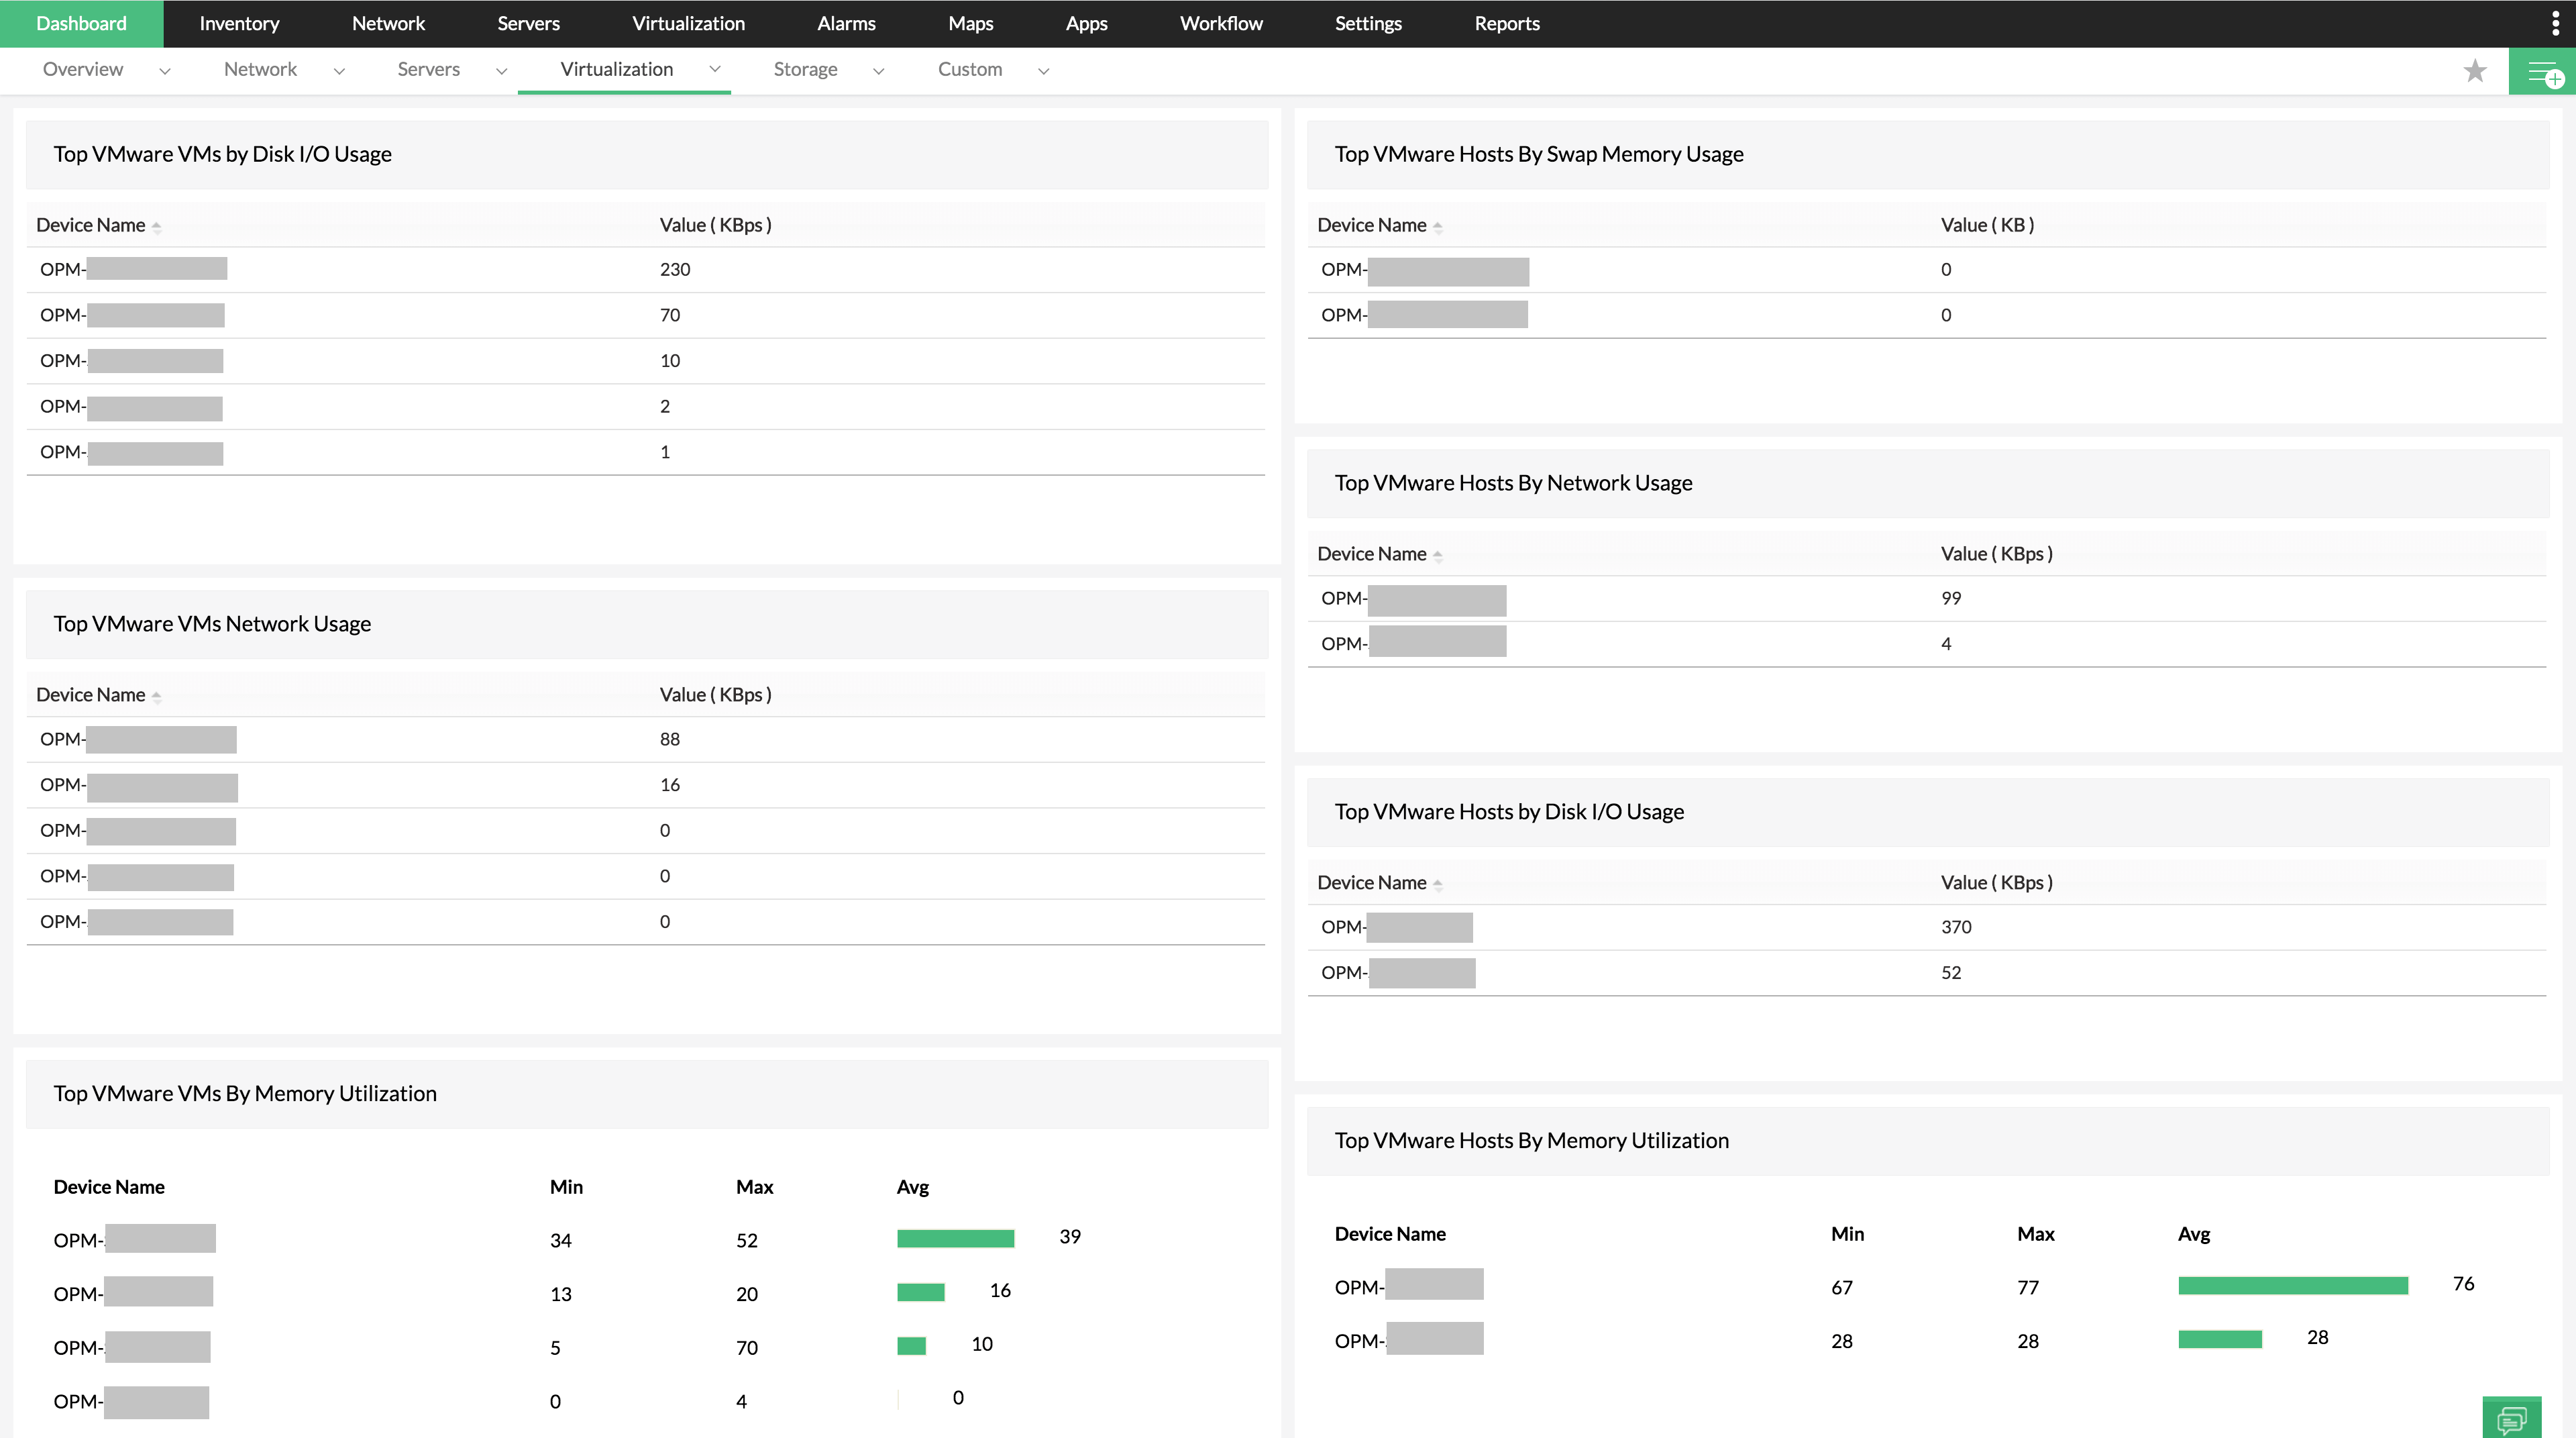
With the dedicated dashboard for VMware monitoring in OpManager, monitoring your ESXi hosts and VMs has never been easier. At a glance, you can see which virtual resources are underperforming, and employ corrective actions to improve network performance levels as swiftly as possible. There's also a dedicated VM sprawl dashboard to identify and avoid sprawl in your virtual resources so your network always maintains peak performance levels.
Also, with NOC views, you can enable the network administrators in your organization to monitor the health and performance of your ESXi servers in real-time. By updating the metrics at a user-defined interval, OpManager makes sure that you only see the latest data of your critical performance metrics, keeping you up-to-date on your network's performance.
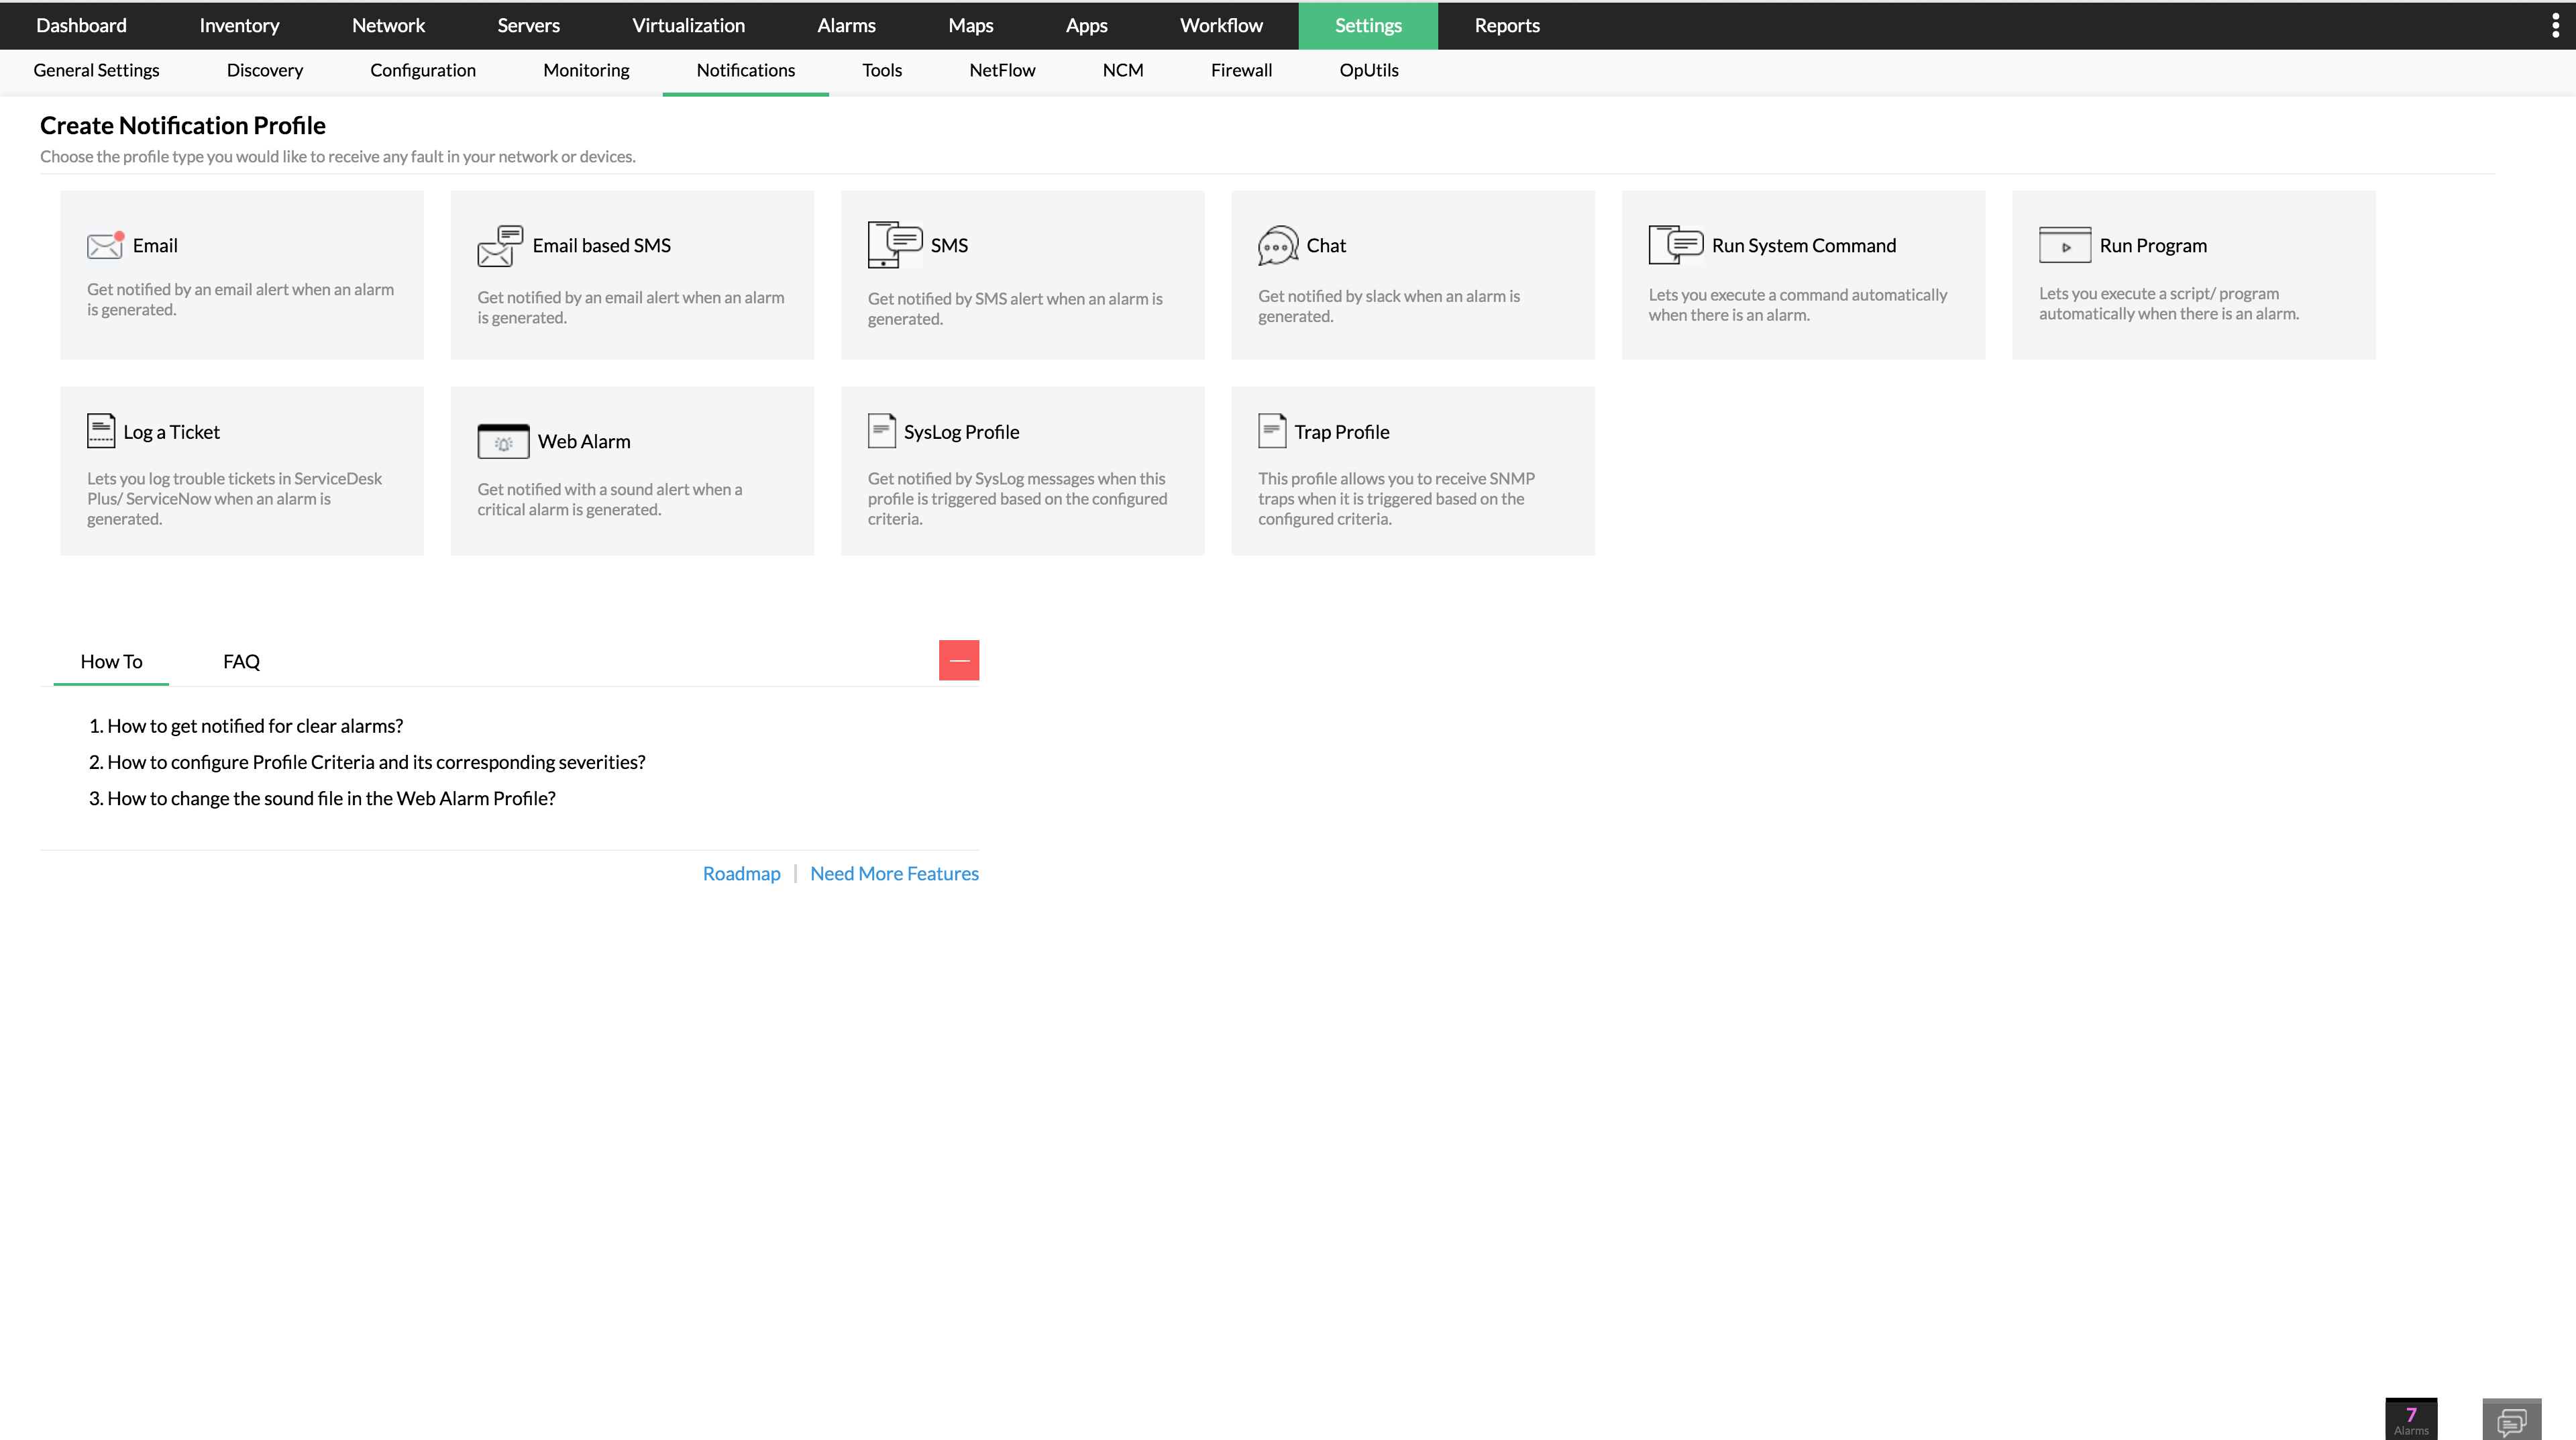
With OpManager, you can get notified instantly when something is amiss in your network by using customizable Notification Profiles. Once you configure the mode of notification and the ESXi hosts you wish to monitor, OpManager arms the Notification Profile for your virtual servers. If the set conditions or thresholds are triggered, you get instantly notified over the medium of your choice, helping you stay constantly informed about performance issues in your network.
OpManager offers several media for notifications, including text or email, or you can configure other actions like creating a ticket on an IT service portal or triggering alarms in other applications.