Enterprise Monitoring Tools
IT infrastructure has become the bedrock for delivering essential business services, be it internal administrative operations or application services hosted for customers. Monitoring IT infrastructure is crucial and has already been established. SMB IT infrastructure requires simple network monitoring tools for monitoring performance and reporting issues. Usually, a couple of IT admins configure networking devices, firewalls, and manually troubleshoot network issues when they arise.
This is totally feasible when the network has a few hundred devices. It is not practical for an enterprise network since it has thousands of networking devices. Enterprise networks have increasing hardware requirements, need dedicated IT teams, and could be geographically distributed.
Enterprise infrastructure monitoring tools should:
- Scale with the enterprise network
- Monitor multiple branch offices in real-time
- Support multi-vendor networking hardware
- Automate manual, routine tasks (configurations)
- Manage and define user roles since monitoring involves numerous IT staffs
Apart from the above, it is fair to expect an enterprise monitoring tool to be easy to use, sophisticated, and all-inclusive in monitoring capabilities.
ManageEngine OpManager - Enterprise Monitoring Solutions
OpManager is a remote network monitoring software designed to monitor dynamic and remote networks. OpManager provides a centralized management console for monitoring switches, routers, servers, virtual infrastructure, interfaces, firewalls, storage devices, and other networking devices. It is a highly scalable enterprise network monitoring tool which helps you analyze network traffic, manage network configurations, switch ports, and IP addresses.
Agentless, enterprise network management software
Agent-based network monitoring solutions require IT admins to install software on every networking hardware to collect information and monitor it. This is suitable for an IT infrastructure with 500 devices. For an enterprise network, this is an impossible task as enterprise networks have thousands of devices and are constantly evolving. OpManager is an agentless enterprise network monitoring tool that eases the configuration tasks. It can be deployed easily in your IT infrastructure and starts monitoring in hours.

Enterprise-grade support
- Scalability: OpManager has a highly scalable engine. With OpManager, you can now monitor 10,000 devices and 50,000 interfaces out of the box.
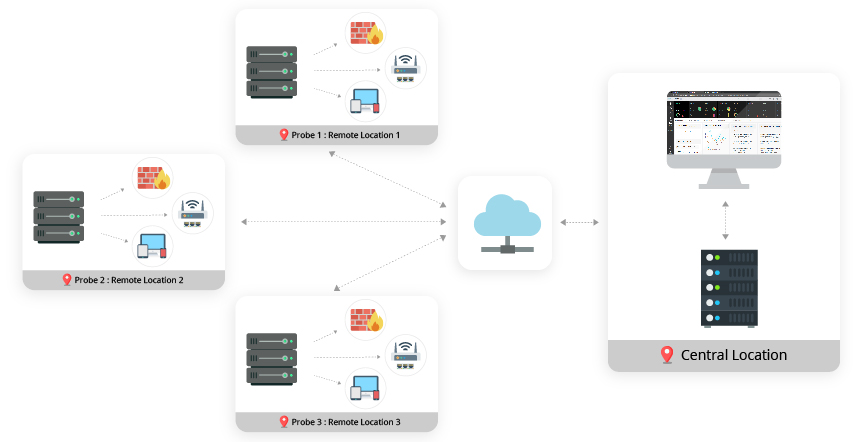
- Remote monitoring: OpManager makes it possible to monitor your IT infrastructure in a centralized console even when you expand to more locations and multiply the resources. With its robust Probe-Central enterprise monitoring architecture, OpManager lets you monitor your local/global branch offices in real-time.

The Central server acts as a unified console which synchronizes data with multiple Probe servers. The Probe server acts as a polling engine. It monitors the routers, switches, firewalls, servers, and networking devices in your IT infrastructure for faults and performance. The Probe server periodically synchronizes data with the Central server.
- LiteCentral: The LiteCentral feature has been brought to picture for efficient scaling of networks with over 30,000 devices. This feature provides a high-level summary of network performance on the Central dashboard, and when needed detailed insights can be accessed from Probes. This reduces the load on the Central server's database and optimizes its performance. Once enabled, the feature cannot be disabled.
- High Availability: An enterprise network, serving clients across the globe, needs to be monitored 24/7. When the server that runs the enterprise network monitor crashes/disconnects from the network, you are left with zero visibility into your network. OpManager provides failover and failback functionality. This ensures an always-monitored network environment with the database also having a secondary copy that is ready to be switched to primary mode anytime. Ensure 100% uninterrupted network management with OpManager.
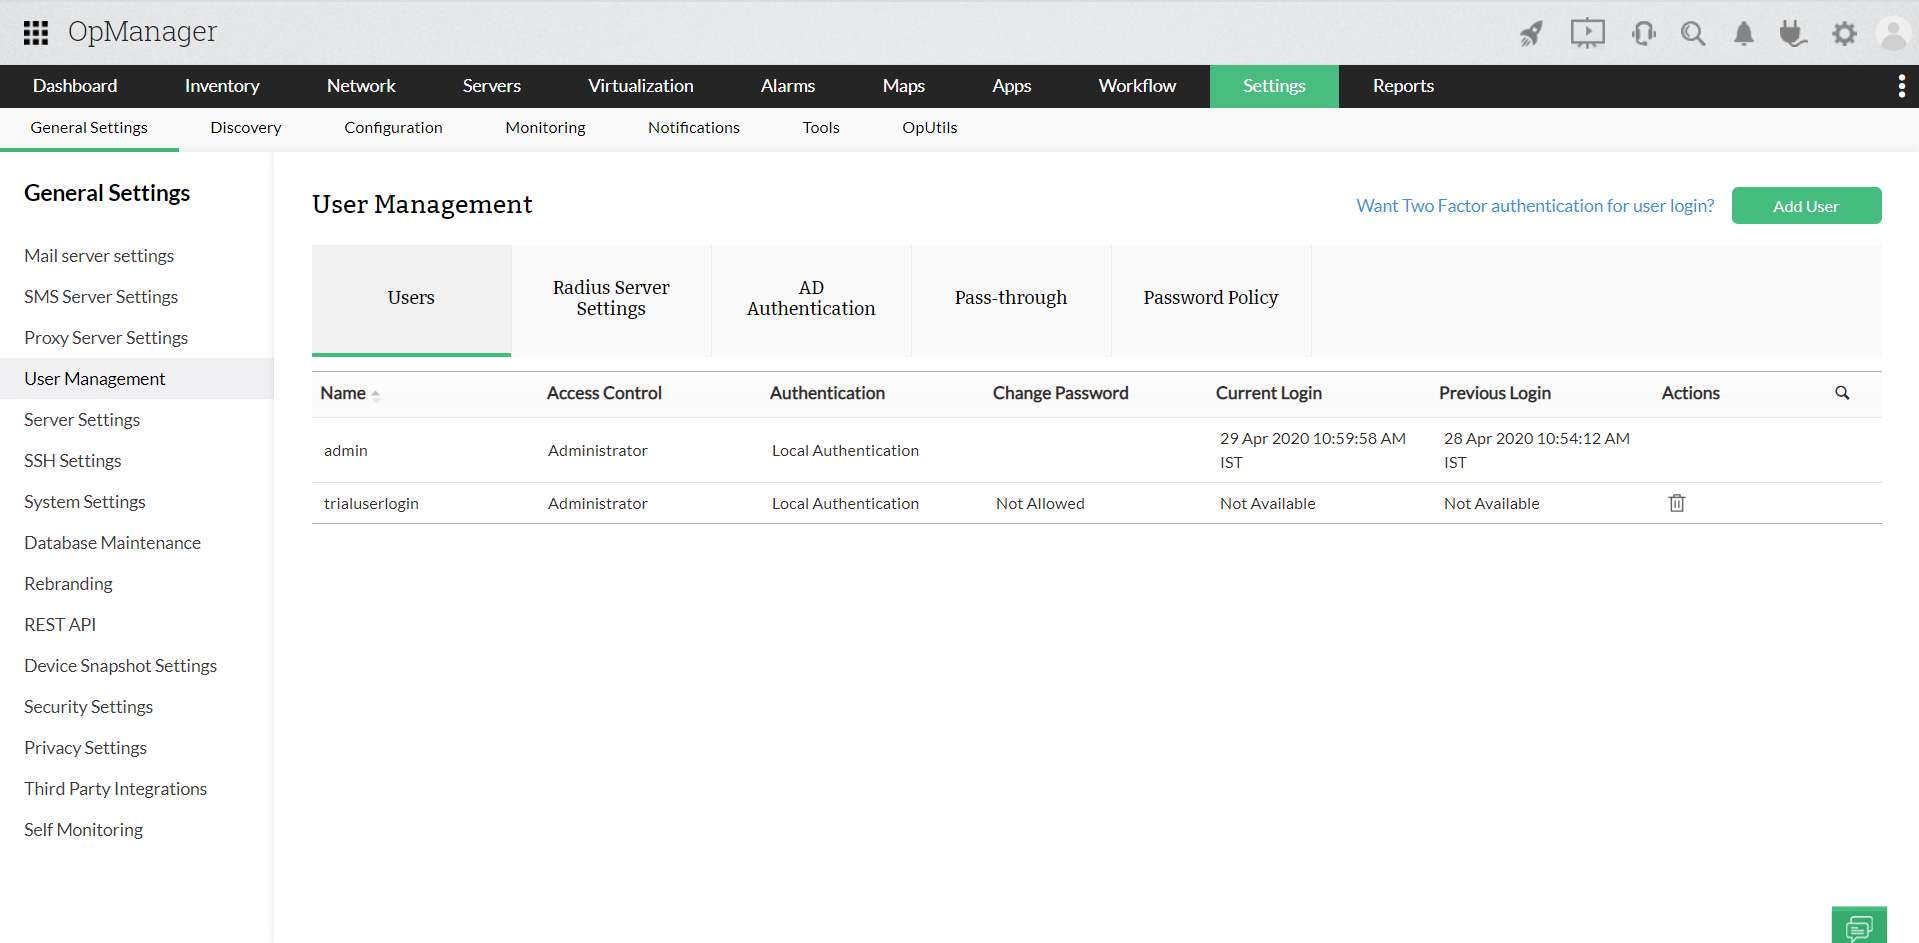
- User Management:User Management helps organizations ensure network security by providing access to designated users. With OpManager, users can be authenticated without using an external third party identity management tool. Apart from providing access to users with roles, you can also define the scope for users. This helps IT teams with multiple staffs as it clearly defines their boundaries. User management in OpManager involves:
- Restricting access to users
- Providing role-based access to users
- Providing scope-based access to users

Extensive hardware support
With OpManager's holistic enterprise server monitoring you can deeply monitor a wide range of servers, and also other networking hardware such as switches, routers, storage devices, printers, UPS, and more from numerous vendors including the likes of Cisco, Juniper, IBM, Aruba, ZTE, etc. It also supports protocols such as SNMP, WMI, CLI, ICMP, Telnet, and more.
- Templates: Configuring and setting thresholds for every device in an enterprise network is a daunting process that sucks up time and human resources. To simplify this process, OpManager offers device specific and vendor specific templates. A template is a predefined set of monitors for a specific type of device/vendor with industry-best practiced thresholds set as default. OpManager offers over 11,000 device templates for effortless enterprise monitoring. They can be further customized as per your requirement.
- Hybrid environments: Enterprise networks have varying needs, so they employ top-of-the-line networking technologies. This helps enterprise networks deliver business services but also poses a challenge with monitoring and managing the network. Using multiple tools for monitoring is not efficient and cost effective as the tools themselves need maintenance and dedicated human resources apart from the learning processes. With OpManager, apart from monitoring switches, servers, etc., you can monitor VMware, Hyper-V, XenServers, Cisco UCS, Nutanix infrastructures, and more, all within a unified console. Additionally, you can monitor your WAN with Cisco IP SLA using OpManager.
Automation
With the increasing network size, you do not want to make the network management more complex than it already is. You can make network management process fairly simple with OpManager.
- Discovery: OpManager lets you automatically discover new devices in your network over a predefined time frame. Once these devices are discovered, OpManager collects data about them and adds them in the Inventory. You can also sort the devices in the Inventory by "Discovered Time" and keep tabs on your enterprise network.
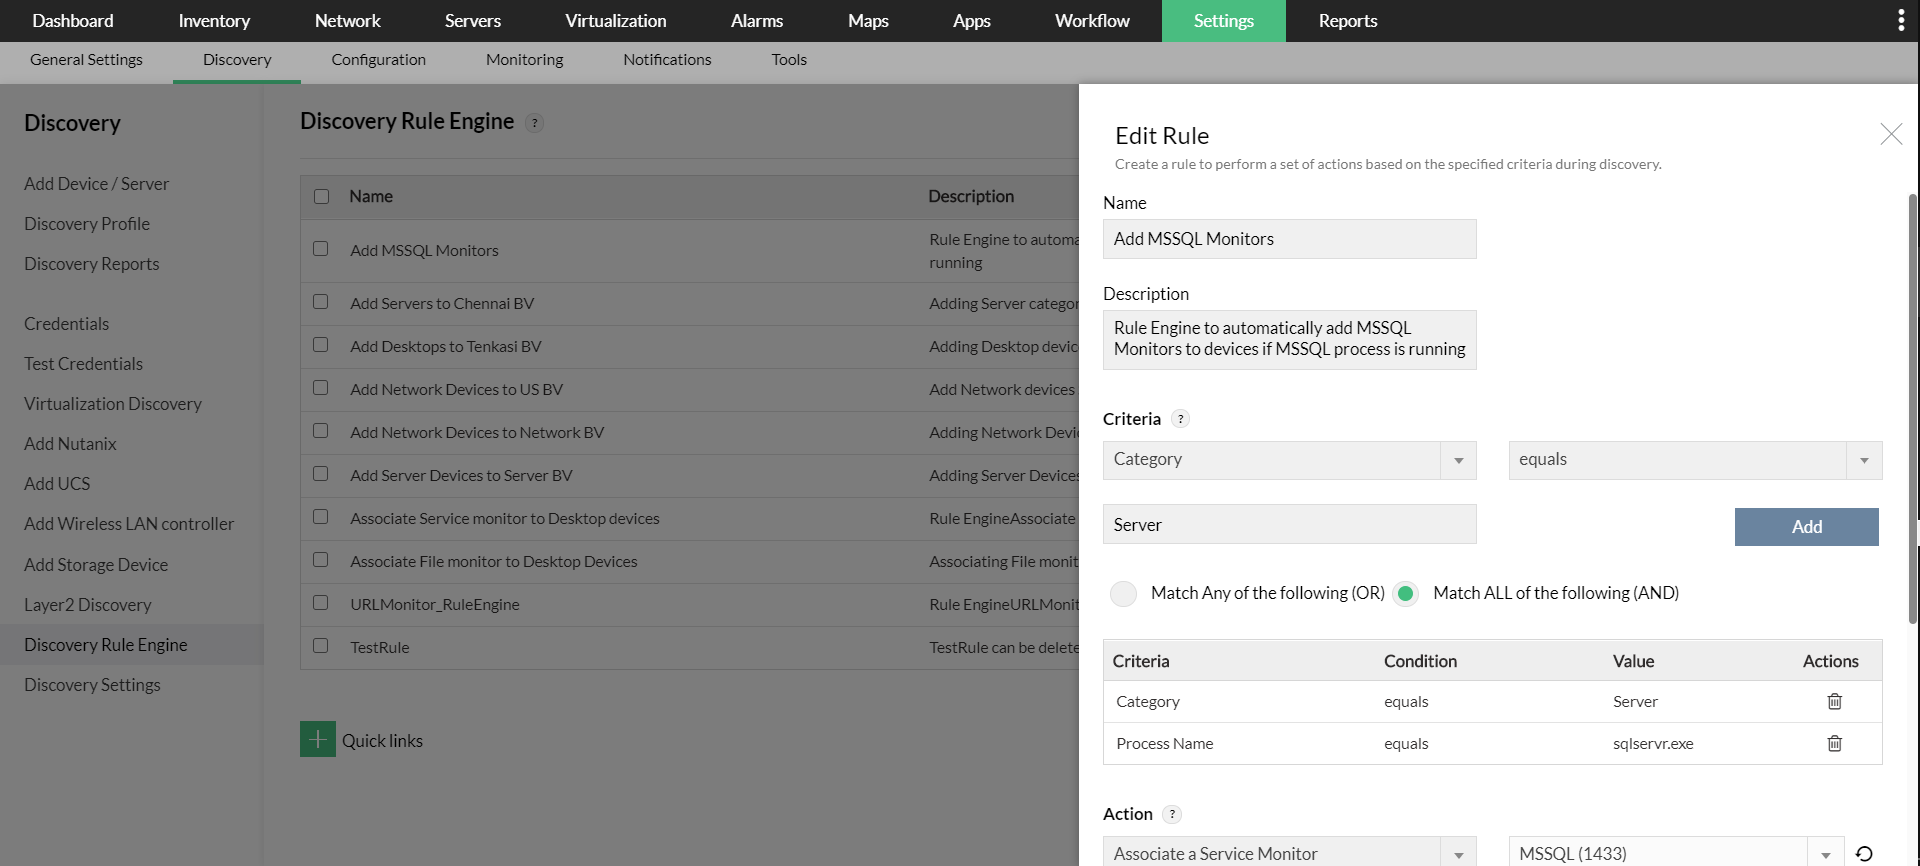
- Discovery Rule Engine:Apart from discovering devices in your network, OpManager automatically:
- Collects information about the device
- Sorts the device
- Synchronizes credentials with the device
- Associates corresponding device templates
- Starts monitoring
All this is done with OpManager's Discovery Rule Engine. You can simplify the network management process with Discovery Rule Engine. It comes in super handy especially for an enterprise network.

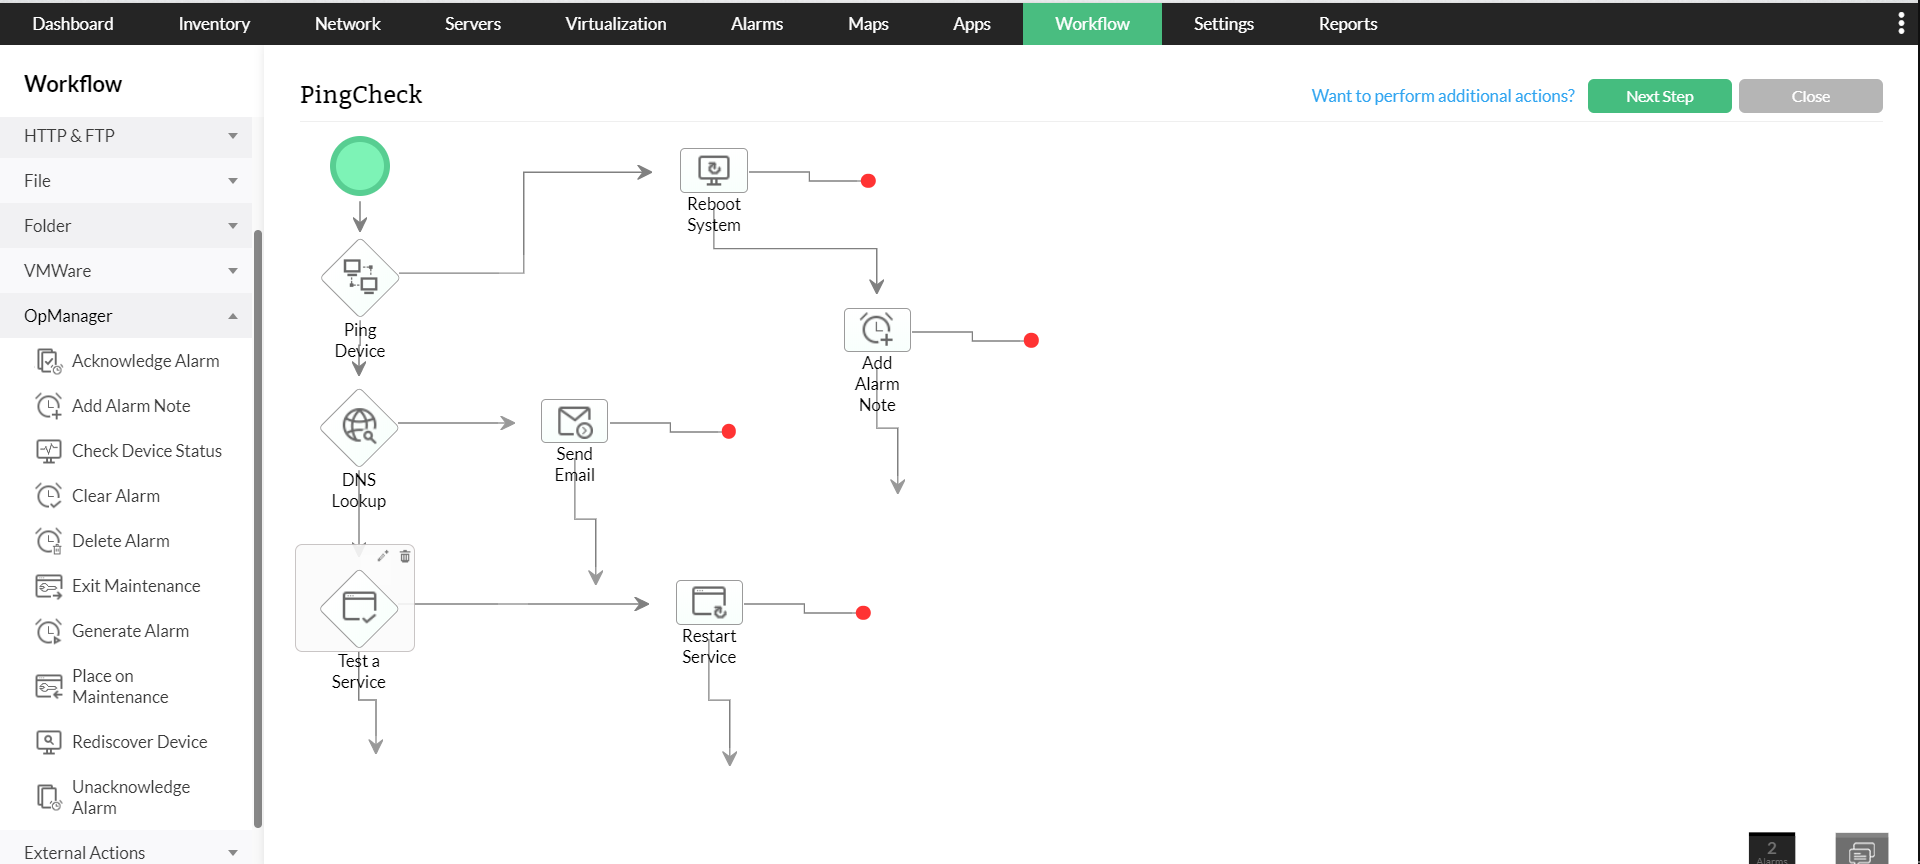
- Workflow: Administrators have preset routine (run book) tasks to perform either during network faults or as an on-‐going maintenance task. These first level troubleshooting steps and repetitive laborious maintenance tasks can now be orchestrated and automated through a powerful IT workflow automation engine. Workflow is an intelligent automation that allows the user to automate tasks by defining the conditions, as well as, selecting the devices and commands. With over 80 workflow actions, users can automatically restart, resume, or stop services and servers, execute configuration templates, and push configurations based on custom rules.

Real time monitoring and reporting capabilities
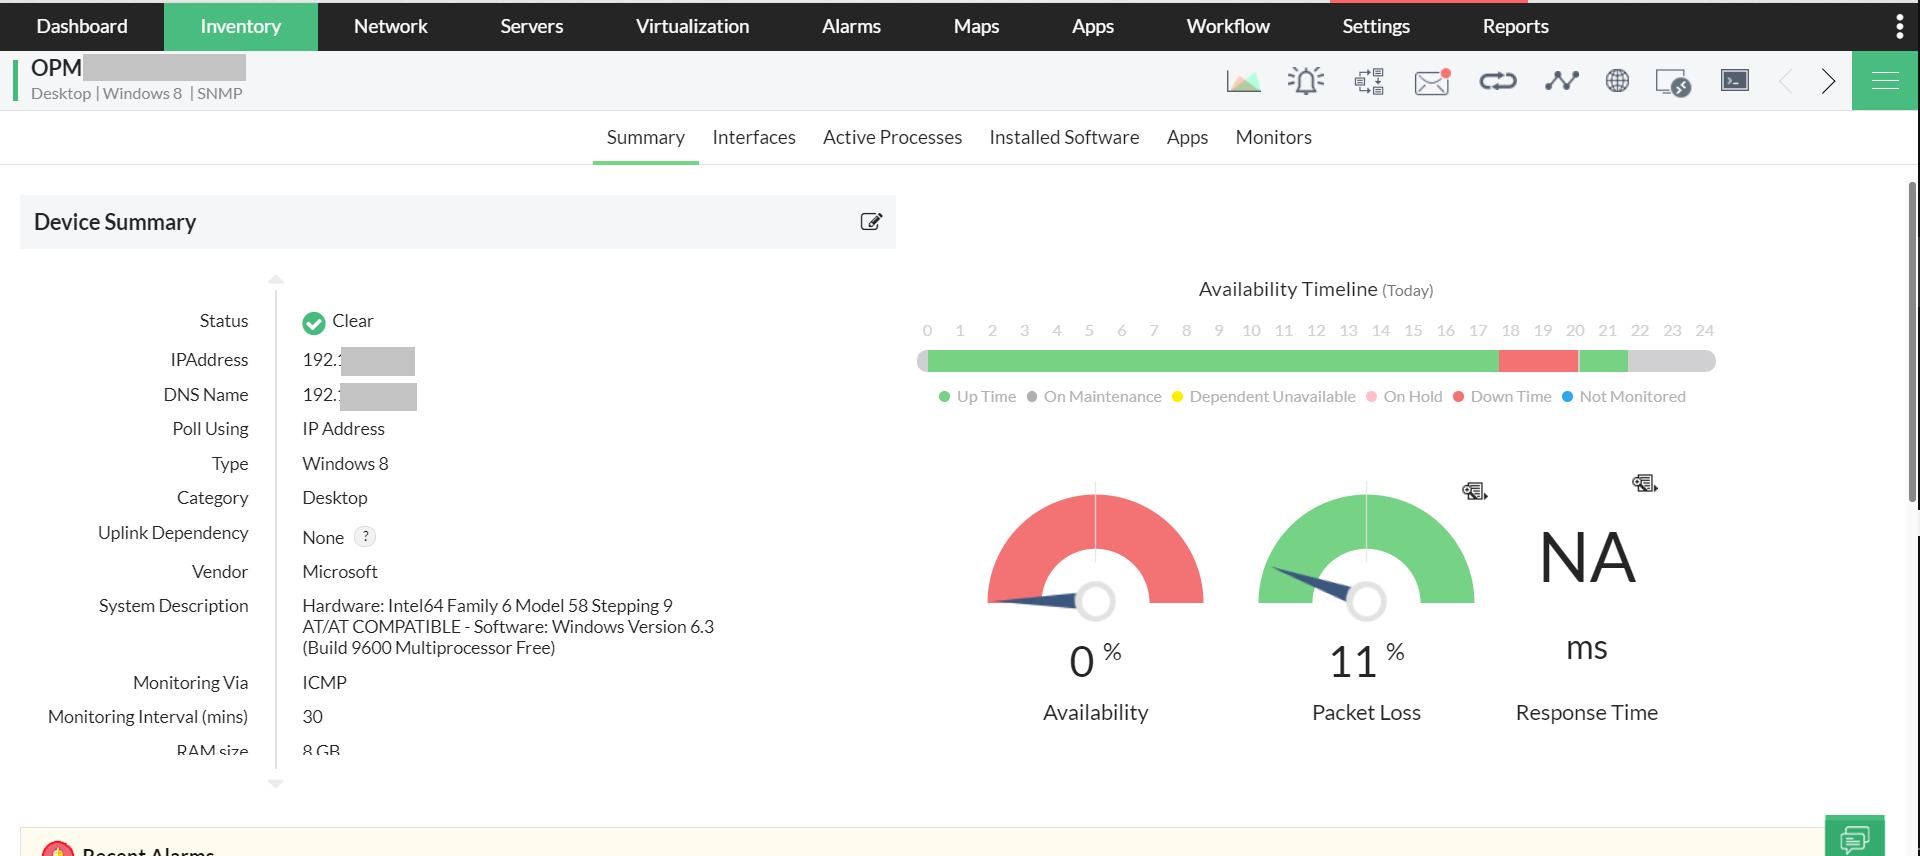
- Monitoring: Loss of speed and data integrity due to poor transmissions is called degradation. Enterprise networks face more of these issues due to the additional distance, endpoints, and equipment at midpoints. OpManager monitors the availability, health, and performance of networking devices such as switches, routers, physical and virtual servers, interfaces, Cisco UCS, Nutanix infrastructure, storage devices, and more in real time for more than 5,000 performance metrics. You can identify performance degradation by monitoring device performance over time. This helps you make planned IT decisions such as replacing hardware, purchasing new devices, etc.
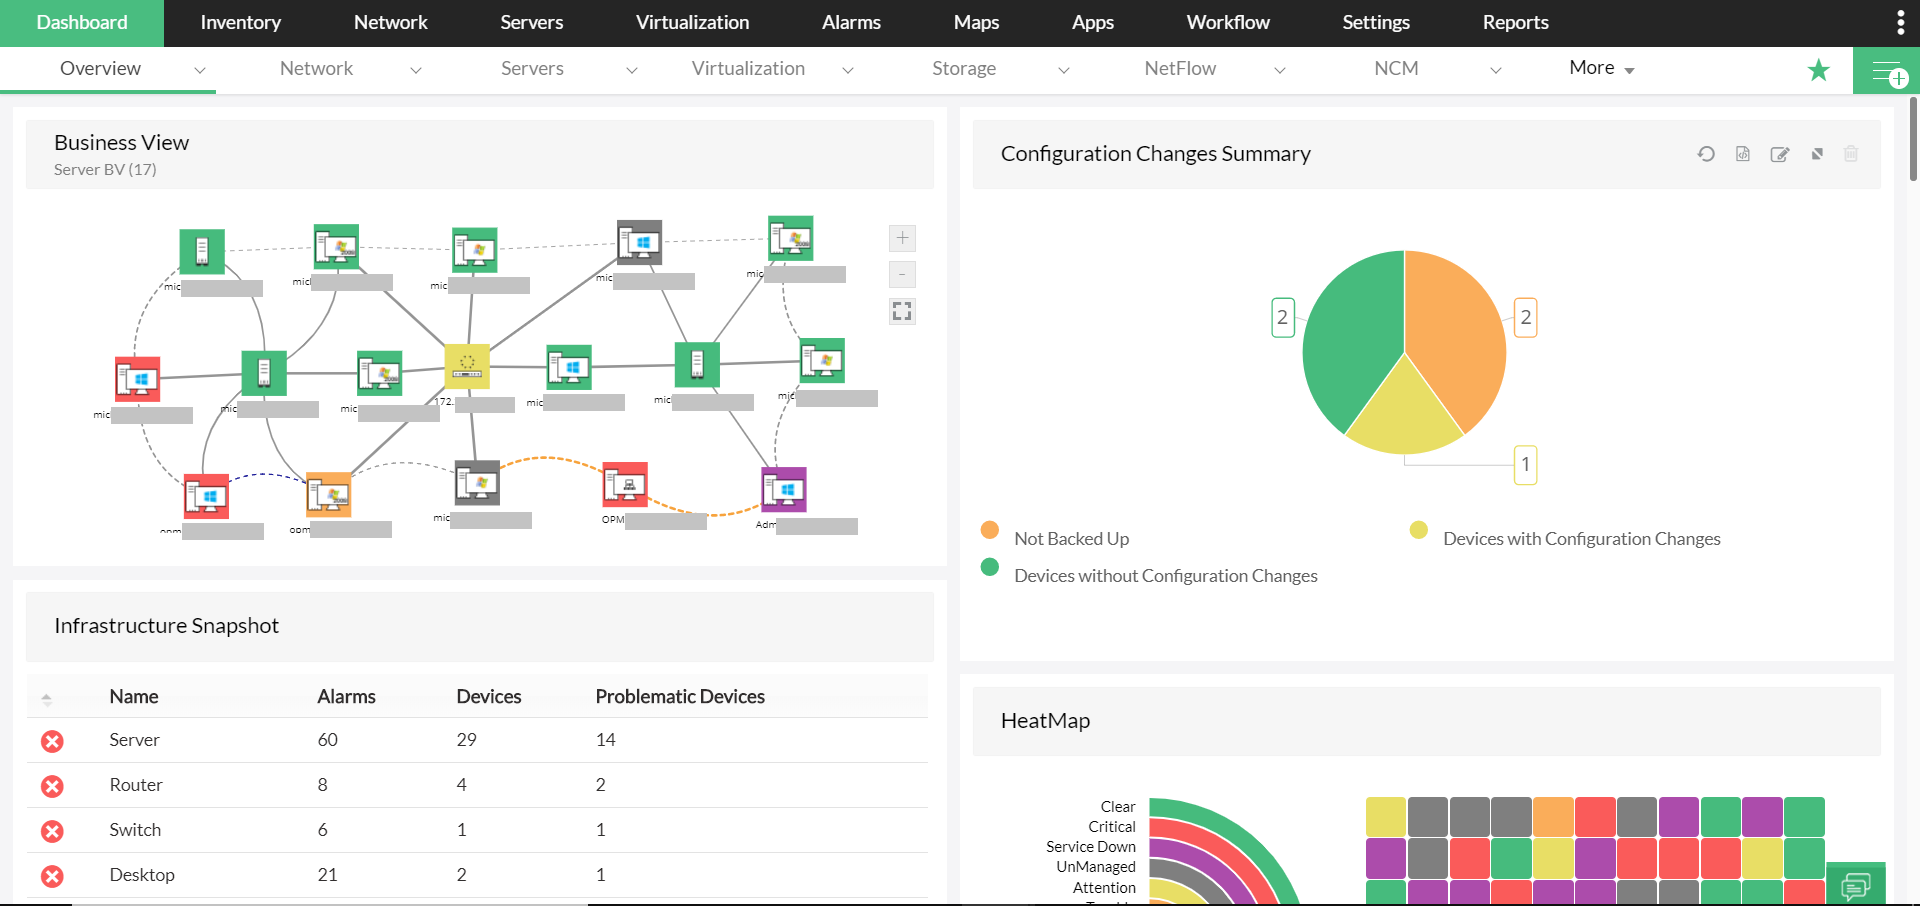
- Dashboards: Dashboard provides a graphical summary of your entire IT infrastructure in one place. It displays real-time information of Key Performance Indicators (KPI) in the form of populated graphs, summary of various devices, monitors, and much more, so you can view mission critical devices in a glance.

- Reports: Reports are useful to identify performance degradation and documentation purposes. OpManager lets you generate reports on networking devices. These reports provide in-depth data on device performance. OpManager offers more than 200 prebuilt reports. Reports can also be exported, scheduled, and easily customized for your requirement.
OpManager makes enterprise network monitoring effortless with intelligent automations and ML-based forecasting. Some of them include:
- Storage capacity forecasting: With the help of ML-based forecasting techniques, OpManager pinpoints when the device storage will reach 80 percent, 90 percent, and 100 percent of the allocated storage, and helps with planning buying decisions.
- Notification profiles: OpManager lets you notify network faults via Slack channels,trouble tickets, and, web alarms if they are not acknowledged, so no alarm goes unnoticed.
- Alarm Escalation: Alarm escalation rules can be configured for mission-critical devices such as application servers, so any fault pertaining to availability, health, and performance is escalated to a higher authority via email or SMS based on user-defined criteria.
- Scheduling: You can schedule configuration backups, reports, and device downtime with OpManager to meet your individual requirements.
- Unified Console: You can perform network monitoring actions across Probes from a single page, the Central's UI. It simplifies device discovery, monitoring and provides real-time visibility into network monitoring data, eliminating the need for manual login into individual Probe servers. With this option, enterprise-wide-actions can be performed efficiently from a centralized location.
- Centralized Configuration: This feature addresses the challenge of modifying and implementing configuration changes in highly distributed networks. IT admins can now apply a configuration in the Central server and sync it with all connected Probes, simplifying tedious organization-wide configurations such as SMS Server Settings, Mail Server Settings, Proxy Server Settings, and much more.
- Visualizations: Determine the availability of crucial services in multiple branch offices with maps and business views. With OpManager, you can easily monitor remote locations visually, and get alerted in real time before network services are disrupted.
- Multi-level thresholds: OpManager offers multi-level thresholds with color codes, so you can identify show-stopping network faults and promptly take action.
Download OpManager now and monitor your enterprise networks with ease.
