The world of IT is progressing rapidly and with it, the needs and requirements of end users are growing. This means the age-old practice of monitoring system performance of all your devices using a predefined set of performance metrics no longer works.
Developers and admins should be able to gain a detailed view of the operational status of your devices by monitoring specific system performance metrics such as processor time, memory, and disk space consumed. This, in turn, will help them manage system resources efficiently, improving the business' overall performance.
Manually monitoring numerous system performance metrics of a large number of network devices requires time and effort. To monitor system performance of the devices in your network without the aid of a network performance monitoring tool, poses the following challenges.
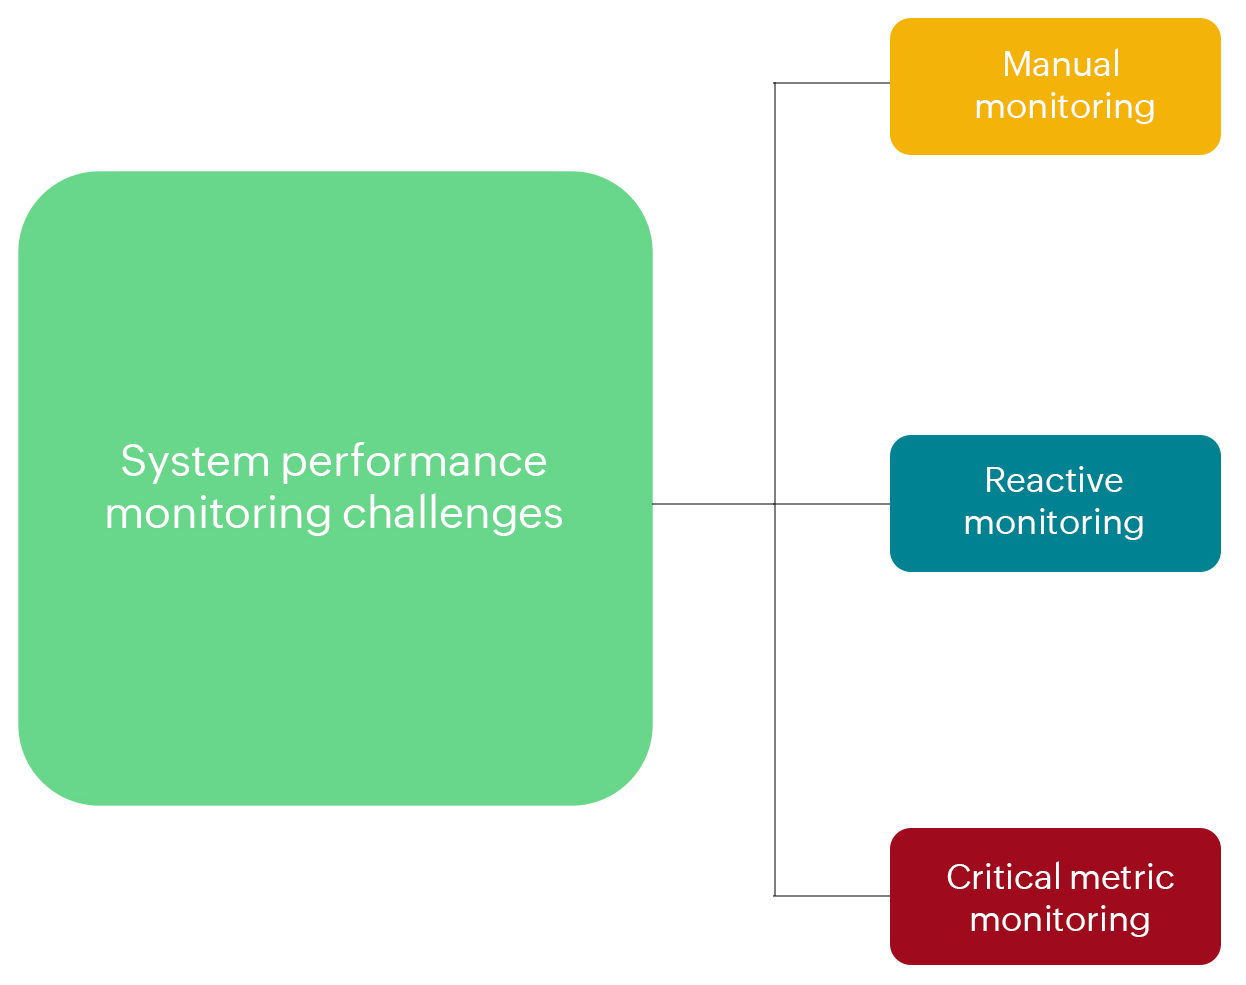
Every IT infrastructure component will have a set of metrics that needs to be monitored to guarantee its efficient operation. Identifying the performance metric respective to a device and applying this change to all the devices in the organization is very time consuming and tedious. Your admins are better off spending their time productively (on tasks like development and bug fixes) rather than applying performance monitors to devices.
Besides the manual requirements, this method of system performance monitoring is prone to human error and leaves very little room to track historical data. All these factors make manual performance management highly inefficient.
Reactive system management, or the break-fix model, works on the principle that a network needs fixing only after it runs into an issue. Any organization employing this age-old practice is bound to run into system outages and network downtime often.
Network downtime can cost a company as much as $5,600 per minute or $300,000 per hour and also impacts customer retention and brand image. When a network is down, it also takes a lot longer to identify and fix the issue. This places more emphasis on proactive system performance management where issues are identified before they can impact the end user and are resolved quickly.
Proactive system monitoring practices like scheduled regular maintenance goes a long way towards the stability of your organization's business.
Identifying critical devices and monitoring their important metrics such as CPU, memory, processor time, services, and network usage to ensure they are performing at optimum efficiency is pivotal for business continuity.
Manually monitoring these critical parameters requires a dedicated human resource to ensure their performance is satisfactory. And even just one moment of carelessness can lead to costly human error that directly impacts business.
System performance monitoring tools like OpManager helps mitigate the challenges addressed above. Besides minimizing the resources employed in monitoring your system performance, they also offer the following benefits:
1. Full network visibility - The visibility offered by a system performance monitoring tool will greatly enhance your ability to adequately understand your network performance. You can understand and monitor every connected device and examine its common metrics. This visibility helps you to make sure performance-affecting metrics are not hiding in the dark.
2. Predict and prevent network downtime - Prevent unexpected downtime by carefully observing indicators of device failure. As a result, you will maximize service availability.
3. Reduce MTTR - System performance issues that are not quickly identified will require a lot of time and effort to fix, and failing to do so will pose a financial threat due to loss of business.
4. Generating network performance reports - A system performance monitoring (SPM) solution constantly tracks performance data and displays it via visual representation on its dashboard. These SPM tools also generate reports that your enterprise can review and convert into printable files.
Hyper-specific performance metric monitoring - OpManager provides numerous performance metric monitors out of the box. Based on the individual system's monitoring requirement, you can choose a specific performance monitor system and associate them to the component. OpManager also displays a graphical representation of the performance monitor's output in real time.
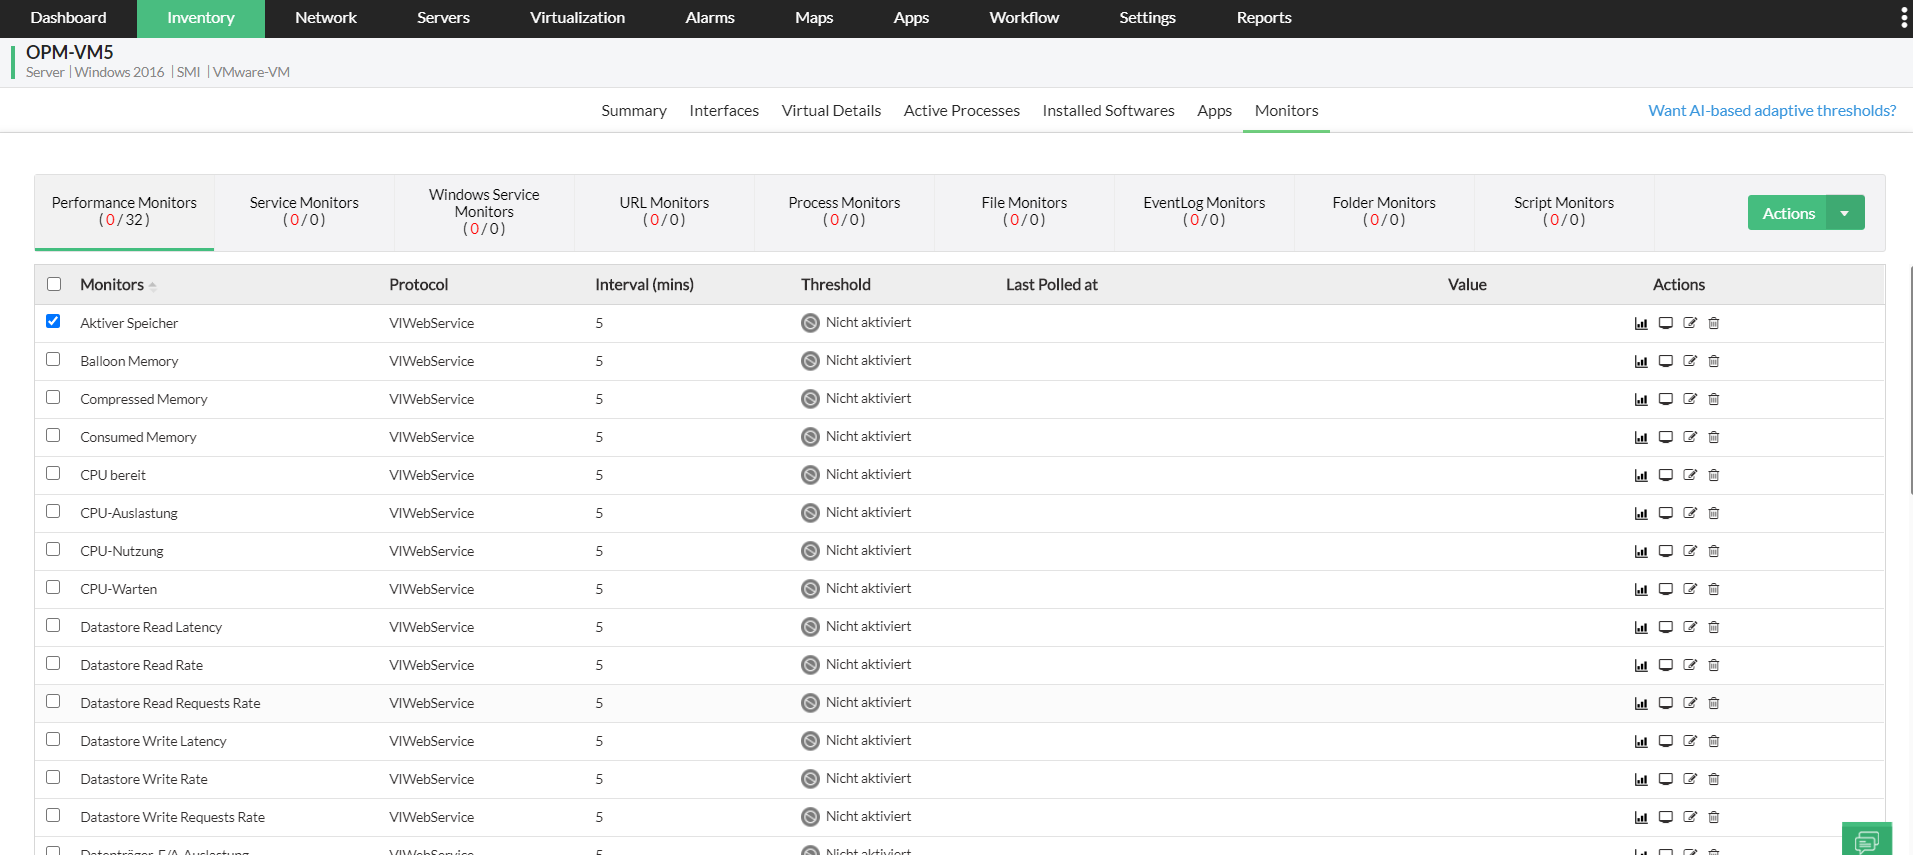
OpManager allows you to discover new devices automatically and add them to your network. By default, OpManager applies a template to every discovered device according to its device category. The applied template contains a list of performance monitors default for devices belonging to a certain category. The system performance monitors listed in templates can be customized, allowing you to save the time and effort required to individually assign such a monitor otherwise.
OpManager contains over 11,000 device templates out-of-the-box.
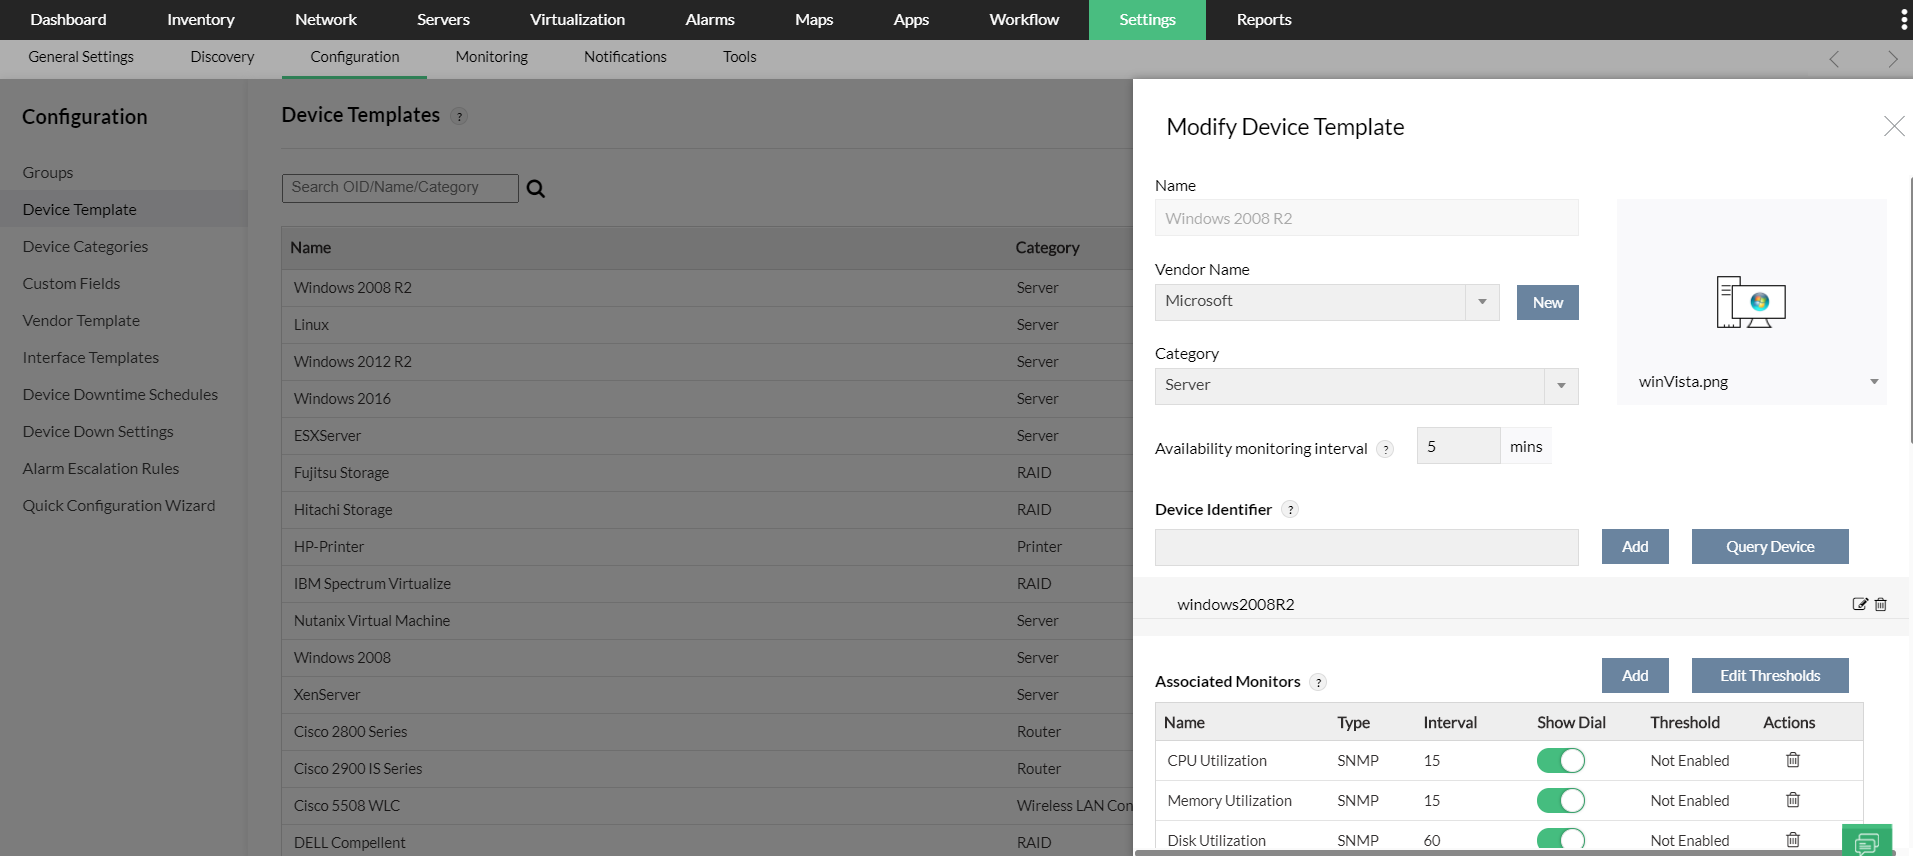
OpManager as a performance monitoring system is capable of monitoring the system performance of devices belonging to a variety of vendors and manufacturers. Over 11,000 device types and around 530 vendors are supported, allowing you to efficiently discover and monitor their performance metrics.
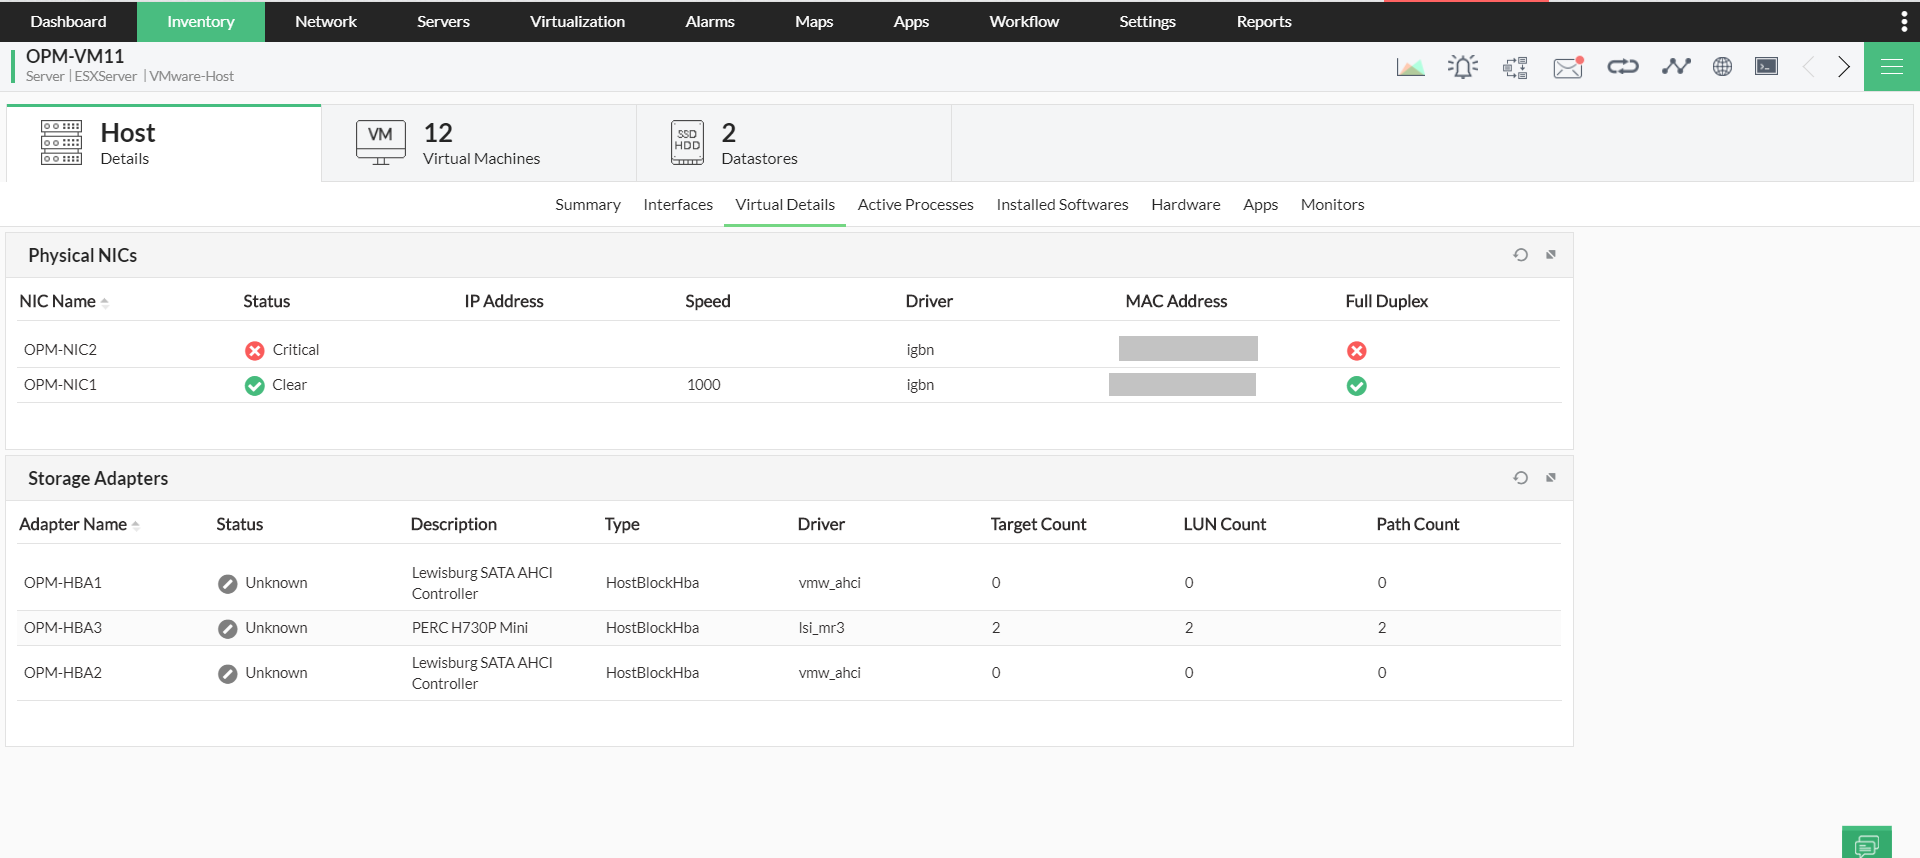
OpManager's virtual system performance monitor automatically monitors all the performance metrics of a virtual machine and quickly displays metrics such as CPU allocation, memory utilization, and more.
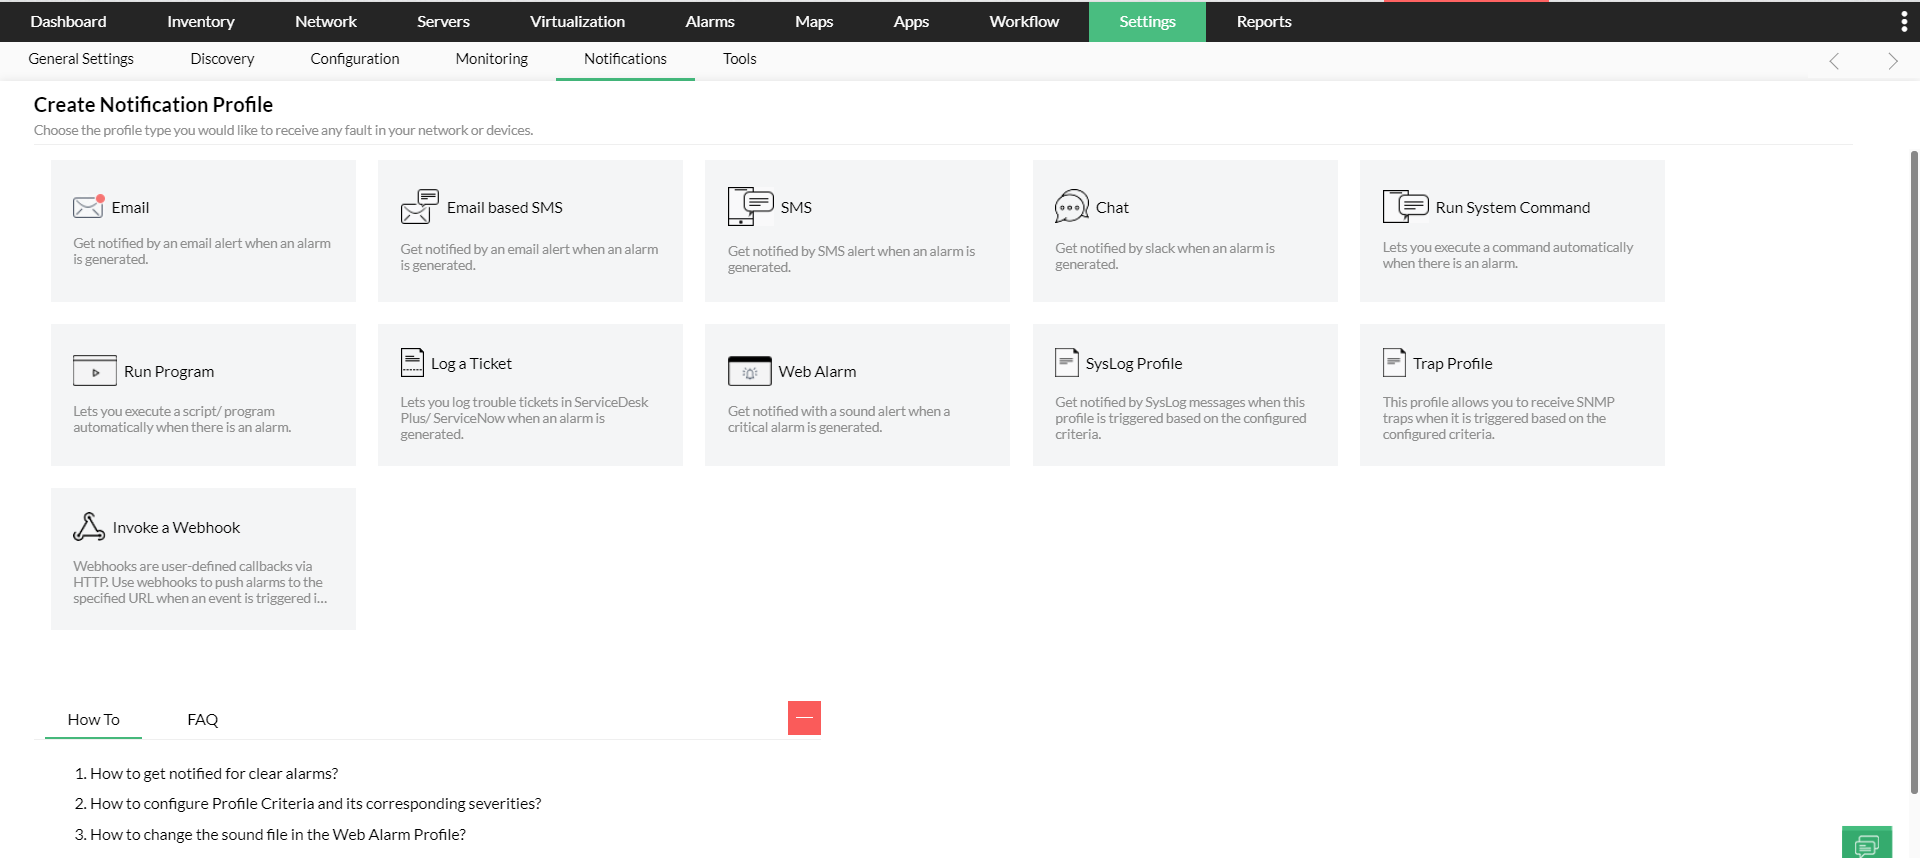
When a threshold is violated, an alert message is generated. Using OpManager, you can choose from one of the many methods to stay notified in case of an alert or alarm. In addition to conventional alerting, OpManager also contains an alarm escalation feature that allows you to notify upper management in case a critical alert goes unnoticed.
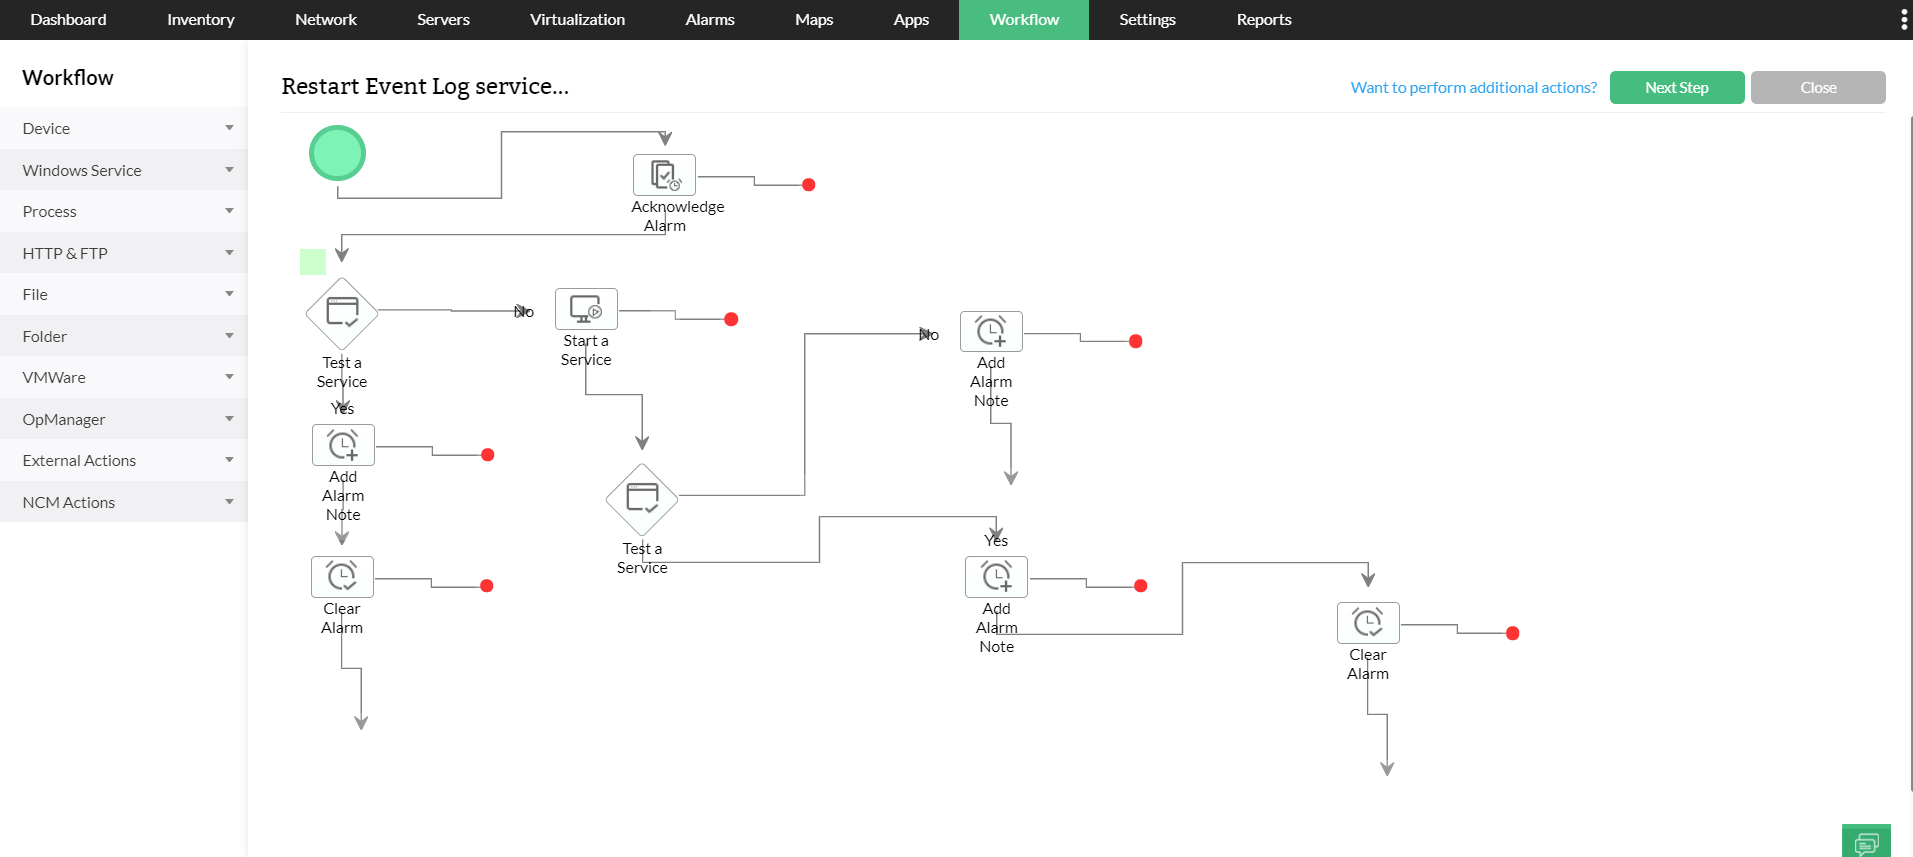
OpManager's drag-and-drop workflow creator allows you to create and execute simple programs. They can be automated to perform basic troubleshooting, saving the time and effort of your IT technicians. In cases like CPU usage exceeding a certain limit, you can even create a workflow to restart the affected device automatically.
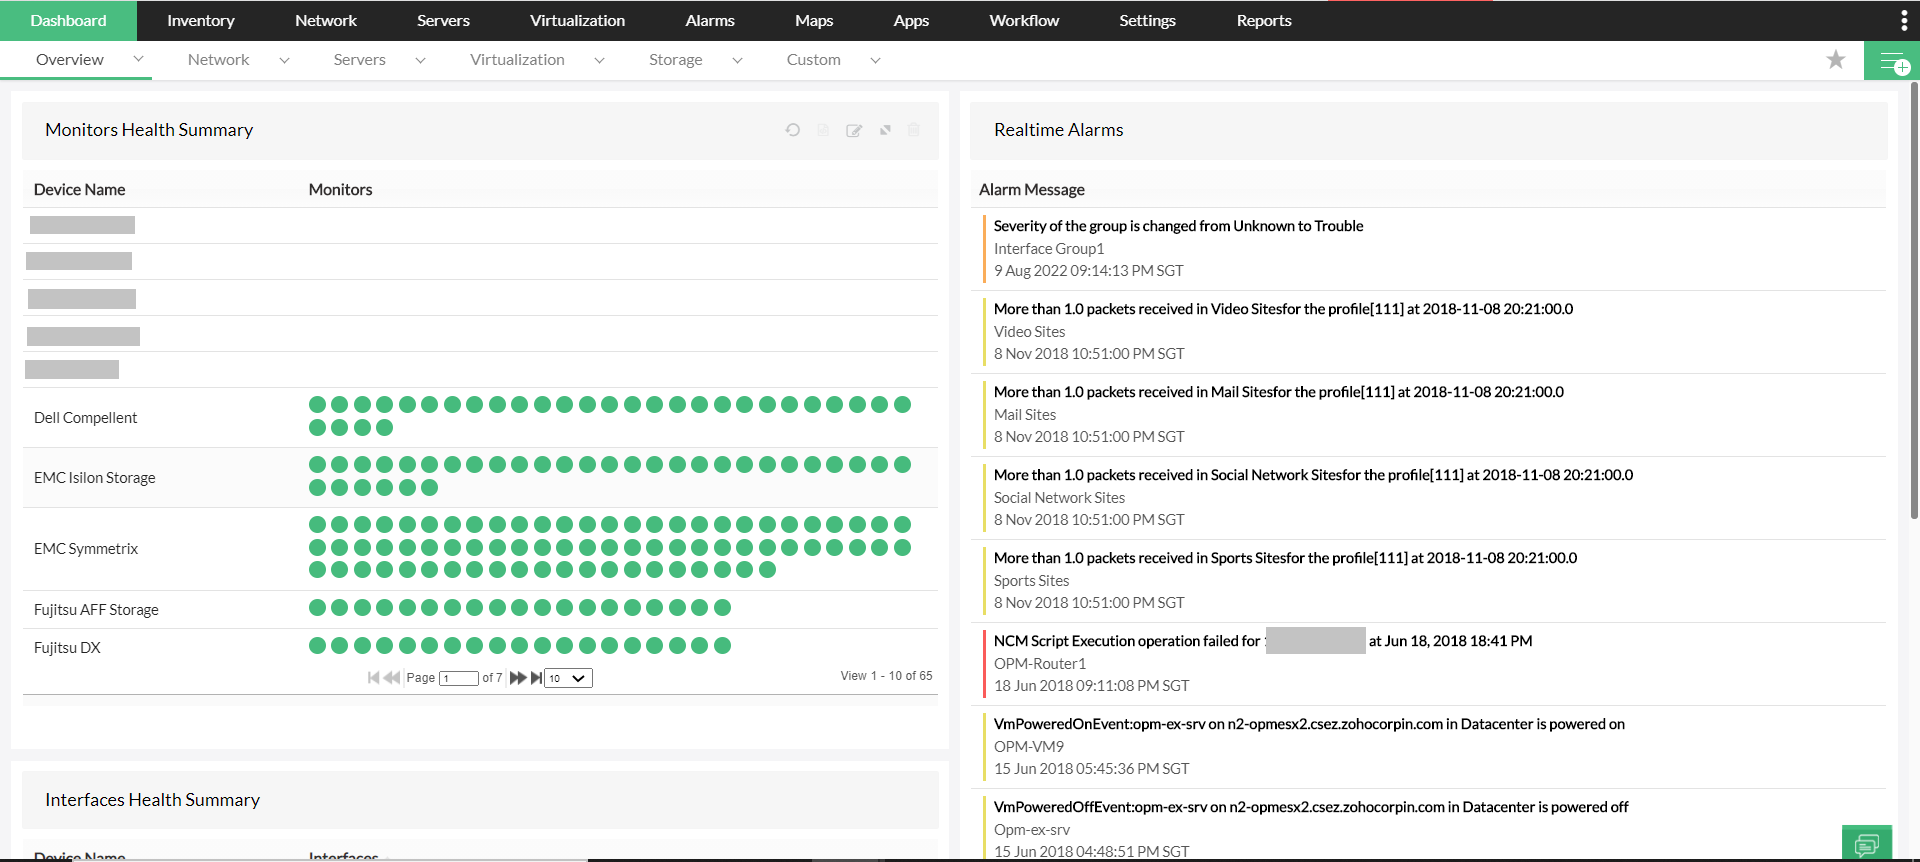
A visual representation of data is pivotal for easier understanding and analysis. OpManager's dashboard contains highly customizable widgets that provides an at-a-glance view of all your system performance metrics including custom views like top CPU utilization, memory utilization devices, lowest resource consuming devices, and more.
To understand OpManager's performance monitoring and system management capabilities better, download a 30-day free trial or register for a demo.