To deliver services seamlessly to their customers spread across the globe, IT organizations depend heavily on their storage network. This is why companies prefer to invest in storage devices that are reliable and offer high performance.
IBM storage solutions are well-known among large enterprises and enable organizations to deliver business-critical services consistently. The flexibility and affordability of IBM storage devices makes them popular among mid-market businesses as well.
While installing durable network storage tools is essential, ensuring their consistent availability and optimal performance is equally important. To ensure healthy operation of your IBM storage products, it is crucial to install powerful IBM storage monitoring tools.
Any monitoring software is expected to cover the following aspects when it comes to storage monitoring.
Before investing in an IBM storage solution, considering the above parameters will help you choose the right tool.
OpManager is a best storage monitoring tool that maintains the health of your IBM storage infrastructure by ensuring maximum network uptime and ideal performance. The following features in OpManager cover the essential aspects discussed above, making it a comprehensive storage monitoring tool.
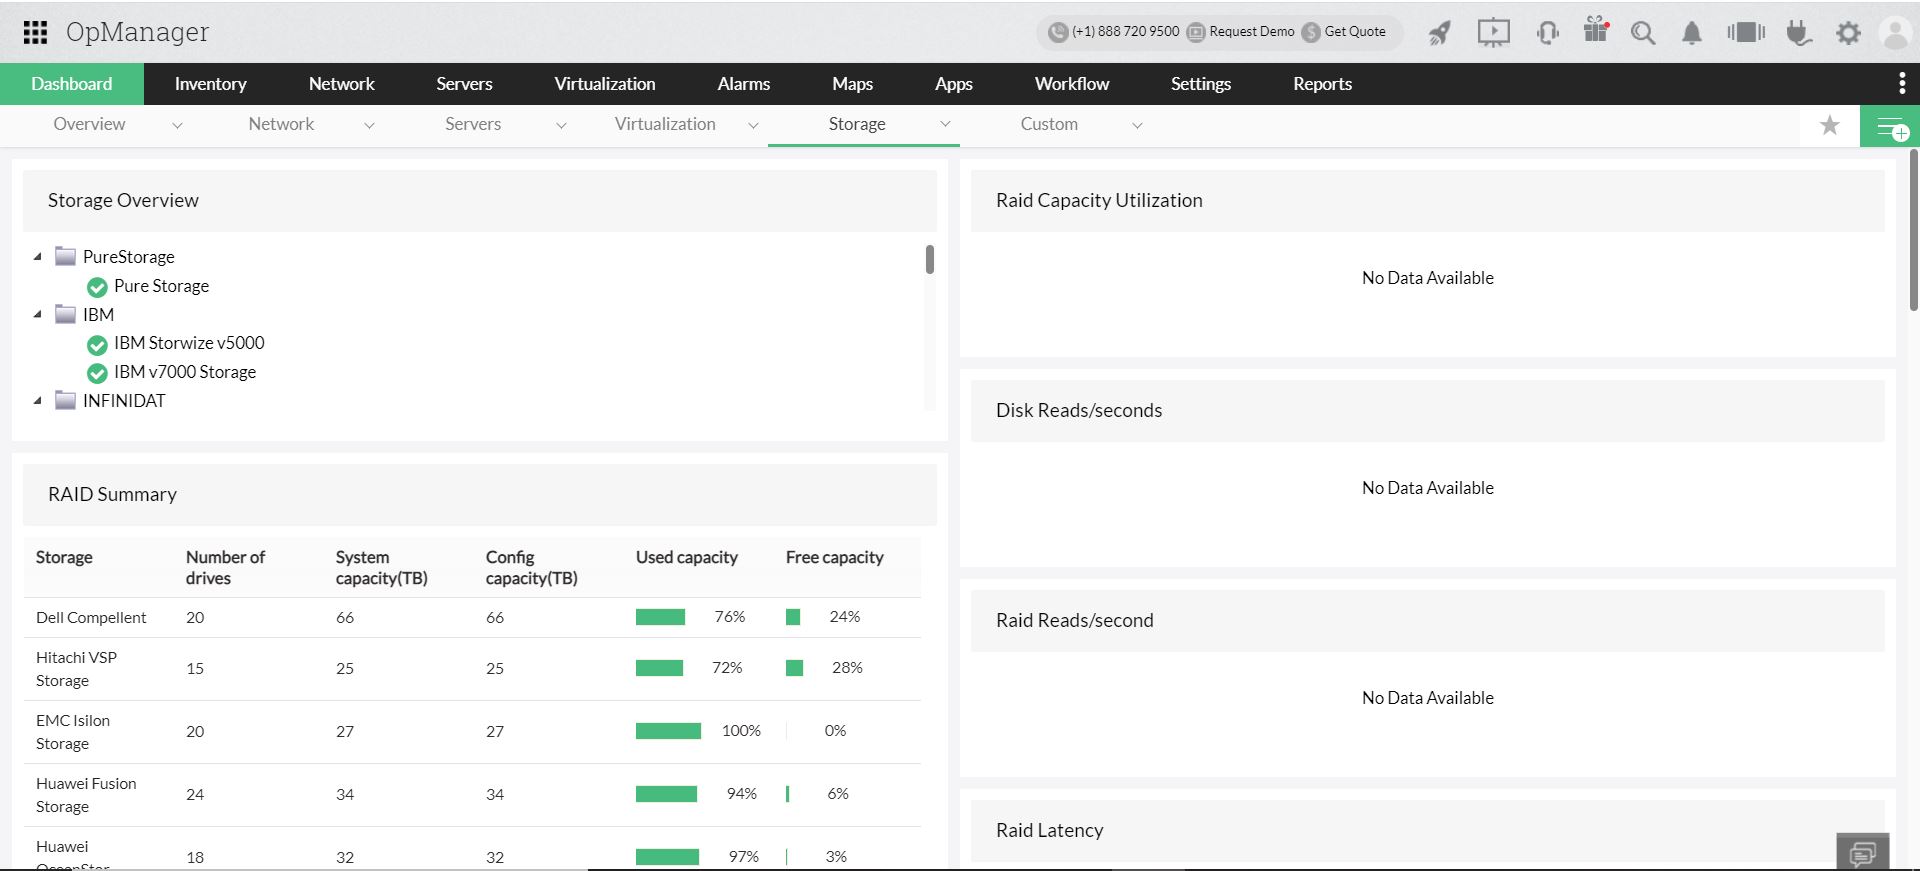
The objective of OpManager’s Dashboard is to enable you to survey the health and performance of your IBM storage devices in one view. You can arrange the most needed and relevant information front and center and also obtain real-time insights into your storage network environment.
The Storage module inside OpManager's Dashboard is built exclusively to present the monitoring information of your storage infrastructure. It simplifies IBM network storage monitoring by displaying data specific to the monitors associated with your IBM storage device models. (All other vendor-specific monitored data is presented here.)

OpManager has built-in, tailor-made device templates for IBM vendor storage devices. These device templates are unique for each device model, and once you discover a storage device, OpManager associates the monitors with the device as per the device template.
Let's say an IBM V5000 is added to your network. OpManager instantly begins monitoring the device model for CPU utilization and capacity utilization, which are monitors that are part of its device template, IBM Spectrum Virtualize.
Apart from this, OpManager provides general device information on availability, response time, disks, LUNs, and other storage information.
Customize monitors
OpManager offers the flexibility to add more monitors, edit the threshold configurations of existing monitors, and add custom SNMP monitors to track storage device performance irrespective of the protocol through which the device is monitored.
You can frame threshold limitations for each monitor such that whenever a defined threshold is breached, OpManager raises an alarm to warn you.
There are five different threshold severity levels, and each severity level is mapped to a color.
The severity-based alarms in OpManager help you act proactively and prevent minor anomalies from transforming into major faults that can seriously damage your system.
For instance, let’s assume a storage device—IBM Spectrum Virtualize—violates the attention severity threshold for latency. An alarm is immediately raised so the IT admin can examine the cause of the increased latency and fix it before the severity level goes to critical.
OpManager also helps reduce the mean time to repair with its powerful integration capabilities. It seamlessly integrates with other applications like ServiceNow, ServiceDesk Plus, and Jira and enables automatic incident logging whenever a fault or violation is detected.
For example, OpManager can be configured to raise fault alarms as tickets in ServiceNow. The tickets will be instantly assigned to a technician based on the priority. With this integration, OpManager accelerates fault resolution and safeguards your IBM storage devices.
OpManager's IBM Monitoring tracks IBM storage products for availability and performance, collects the monitoring data, and stores it as reports to give meaningful insights on storage performance.
Reading these reports helps you recognize fault-causing trends and work on them proactively to maintain performance.
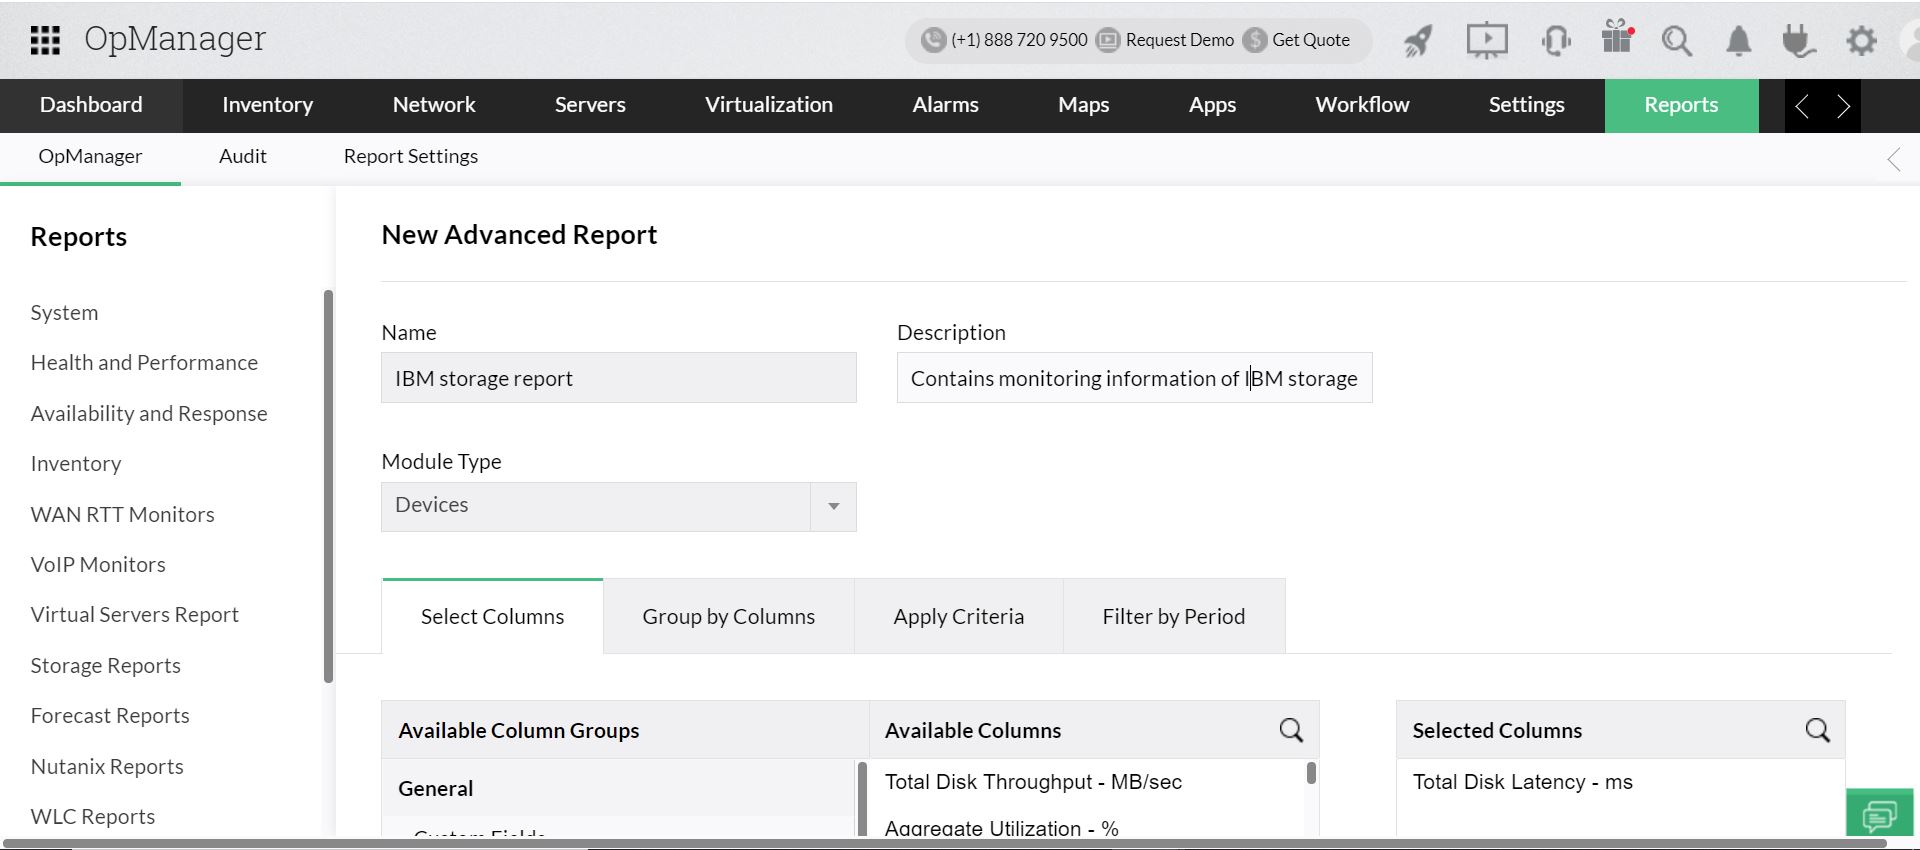
By default there are over 100 reports that contain historical data on monitoring. Apart from this, you can create advanced, customized reports, and this is particularly useful to view specific monitored parameters for selected storage devices.
For instance, you can create a report on Total Disk Latency for all IBM storage devices. You simply need to specify the IP range of your IBM storage network or mention the device type along with device names, and a report containing only the needed information will be generated.

A healthy storage network is pivotal to propel your business forward. With its powerful storage monitoring features, OpManager optimizes performance, facilitates storage expansion, and helps maintain a robust storage network to achieve your business goals.
Learn more about OpManager, and download a free, 30-day trial version. You can also experience an online demo at zero cost, or schedule a free, personalized demo with our experts who can answer all your product questions.