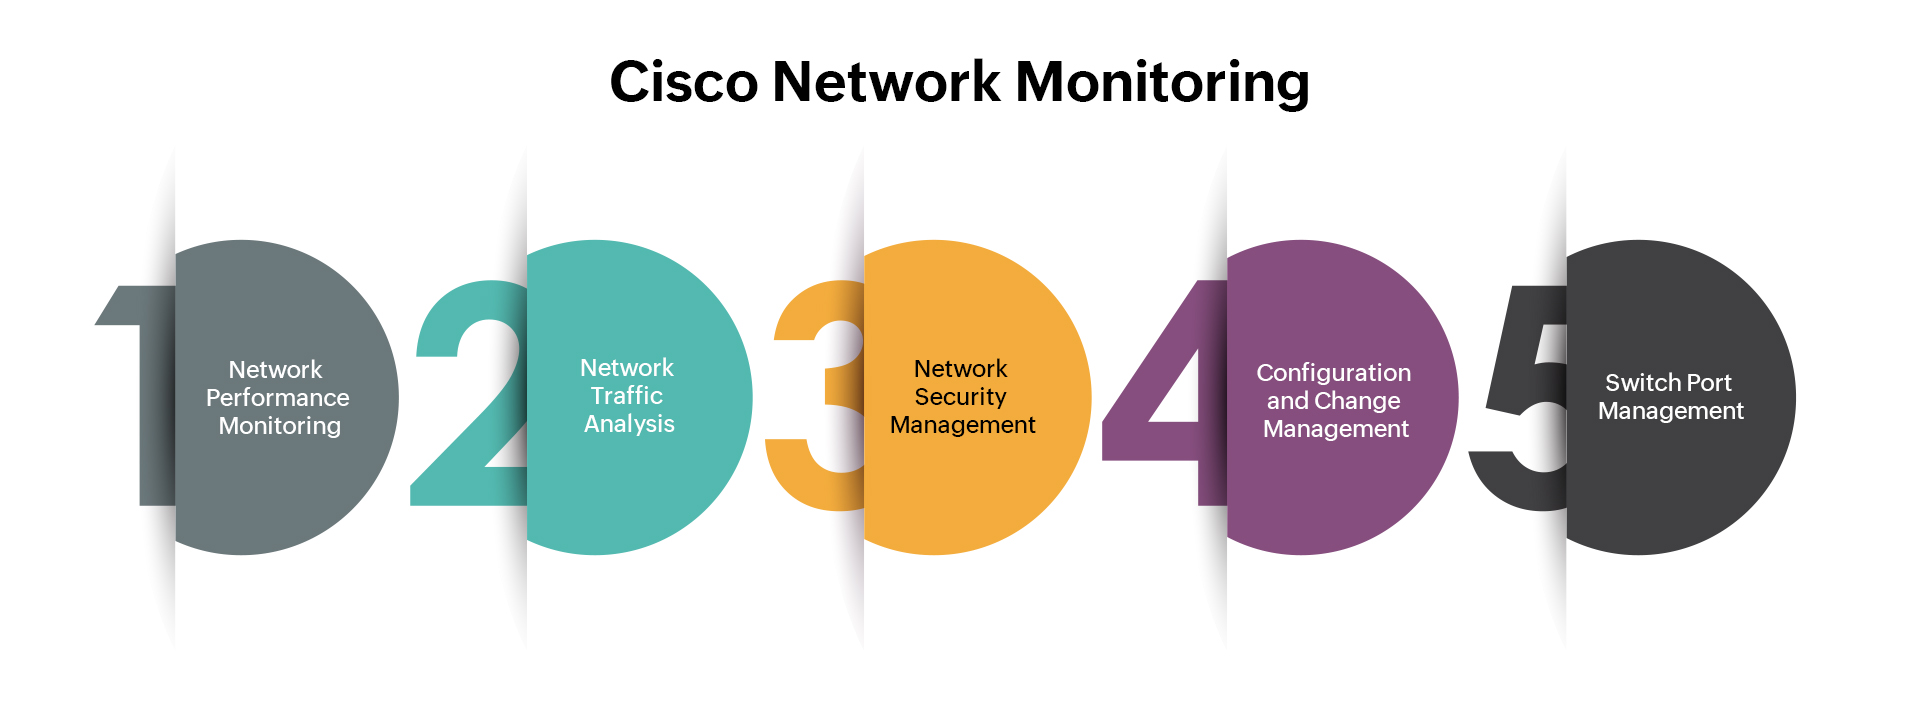
Cisco, one of the pioneers in the IT industry, offers a wide variety of devices ranging from switches to blade servers to address every IT management need of SMEs and enterprises. Managing an IT shop full of Cisco involves lot of management challenges such as monitoring for availability and performance, managing configuration changes, archiving firewall logs, troubleshooting bandwidth issues, and much more, which demands potent Cisco network monitoring software. OpManager's Cisco monitoring capabilities offer comprehensive management support for Cisco environments.
OpManager's Cisco network monitoring tools support a wide range of Cisco devices such as ASR series, Catalyst series, Nexus, UCS, etc. and technologies such as NetFlow, IP SLA, CBQoS, NBAR, and much more. OpManager's Cisco monitor takes an integrated approach and supports all these devices and technologies single handedly so that you can view, analyze and control them from single console.

Monitoring is very essential because it helps identifying problems proactively. With networks being the backbone of today’s business operations, it is highly impossible to have even a few minutes of downtime. Monitoring network via scripts or manually is of no use as both the approaches are reactive. OpManager is a Cisco monitoring tool that takes a 3-step approach in monitoring the Cisco devices - data collection, threshold verification & fault notification. OpManager monitors all Cisco network devices such as Nexus, ASR, Catalyst series via SNMP and CLI protocols and monitors Cisco UCS via UCS Manager API.
OpManager periodically monitors the Cisco devices and cross verifies the collected value against the set threshold levels and notifies via email and SMS to assigned technicians and network admins about the fault once the threshold is violated. No manual intervention is required. Cisco monitoring software helps you identify the fault at its early stage and fix it before impacts the business or end users.
With over 200+ widgets available out-of-the-box, you can create dashboards and have a quick look at all the performance metrics that you wish to see.
OpManager supports more than 1000 devices of Cisco out-of-the-box. Once you install OpManager you don’t have to spend much time in configuring. You can start monitoring them straight away and receive alerts for faults.
OpManager out-of-the-box monitors performance metrics such as CPU/memory utilization, backplane utilization, buffer hits, buffer misses, input/output packet drops, CRC errors, interface collisions, interface input/output bits, & much more periodically via SNMP. Cisco network performance monitor allows you to easily create custom SNMP monitors from the Cisco MIBS.
Interfaces need to be monitored because they decide the connectivity of the network. OpManager's cisco port monitor recognizes more than 230 interface types and monitors them for availability, traffic, errors and discards via SNMP. You can set thresholds to all these performance metrics and monitor Cisco proactively.
Network maps pictorially represent the connectivity between devices and other networks. OpManager draws a network map by discovering the seed device and other interconnected devices, and draws a map. The map is always up-to-date as it automatically adds or removes the devices once they are added or removed from the network.
OpManager monitors all the blade servers, fabric interconnects, fabric extenders, virtual interface cards, rack mount servers, etc. for performance. It leverages UCS Manager XML API to monitor the components. OpManager also supports VMware monitoring for the VMs inside UCS. The benefit with this Cisco network monitoring tool is you can monitor your network and server infrastructure together from a single console.
The most common bandwidth issue reported by end-users is that they find it slow to access the business critical applications. To gain more visibility into such issues, SNMP based monitoring is of no use. You need to adopt advanced technologies such as NetFlow from Cisco to understand your bandwidth utilization across applications, users and devices. With NetFlow-based monitoring you can perform in-depth traffic analysis and determine the who, what, when and where of bandwidth usage.
OpManager's cisco port monitor gives you the right insight you need on your bandwidth by performing network traffic monitoring & security analytics in real-time. The NetFlow/ IPFIX flows are typically exported from the Cisco routers, switches & firewall to the NetFlow collector inside OpManager, where the collected Flows are stored in the database for further analysis. It helps you to analyze your network traffic in detail and provide reports on traffic usage by IP address, applications, port & protocols. This Cisco network monitoring tool also supports a wide variety of Cisco technologies such as NBAR, CBQOS, IPSLA,etc. and devices such as WLC and WAPs.
OpManager's cisco monitor also supports a wide variety of Cisco technologies such as NBAR, CBQOS, IPSLA,etc. and devices such as WLC and WAPs.
Get real-time visibility into interface traffic with Cisco network monitor and compare them with it's max speed, average speed and volume present in the live graph. You can get instant visibility into how much bandwidth was used up by hosts, applications, and conversations across a specific interfaces. Bandwidth reports summarizes your overall bandwidth usage statistics to help you take suitable decisions regarding bandwidth management.
NBAR helps you overcome the limitations of identifying the bandwidth usage of applications with dynamic port. It helps to classify applications with Layer7 AVC and provides reports on NBAR2 applications traffic and its percentage to total traffic along with details such as application name, source and destination IP, source and destination port, protocol and size of application.
CBQOS (class based quality of service) enables you to view network traffic segmented by class of service and measure the effectiveness of your QoS policies. It lets you validate your QoS policies with reports on pre-policy, post-policy and drop in different traffic class.
OpManager's cisco monitor enables you to monitor continuous traffic on the network such as to measure latency and performance of VoIP connections and measure the round trip time between different branches in the WAN. It also provides medianet reporting for parameters such as jitter, packet loss, and RTT. You can also monito and gauge the performance of your linux devices using a linux network monitor like OpManager.
Cisco WLC helps you monitor traffic over wireless controllers and drill down to stats on top applications, SSIDs, APs, clients and QoS. You can drill down to conversation details to keep track of your bandwidth usage and secure the WLAN from threats. Learn more
Security devices generate tons of security and bandwidth log data, if analyzed will provide network security posture. Proper tuning of the policies and configurations of the devices will strengthen the network security. Analysis of policy and log data will address your following security requirements.
OpManager's cisco network monitoring capabilities support a variety of Cisco security devices like PIX, ASA, FWSM, SSM of CSC, SSL WebVPN, SSL VPN Client, VPN Concentrator and IronPort proxy.
OpManager collects and analyzes logs from the security devices and generate security and bandwidth reports. It presents detailed picture of virus, spam activities and attacks happened in the network in the firewall security reports. Answers who is using the bandwidth, for what purpose, which protocols used, URLs visited and bandwidth consumption in real time. It analyzes the usage and non-usage of rules, policies for anomaly, generates reports to optimize policies and suggest reorder of rules/policies. Alerts for bandwidth thresholds, anomaly security events and any security event of your interest.
Tackle the shadow IT
OpManager offers Cloud Control reports to find out who are using which apps/app categories.
Performance of firewall depends on strong and effective firewall policies. OpManager analyzes the policies, will let you know the anomalies in them, will suggest reorder of policies based on criticality and usage. With the help of these reports, you can optimize the policies and strengthen the network security
OpManager collects complete information about your company's internet bandwidth usage from the firewall. It presents a variety of reports like who is using, how much, which protocol, what websites, across which geographical locations, inbound, outbound, intranet and internet. With these, you can optimize the bandwidth usage. You can instant action for sudden jump in the usage with alerts and live reports.
OpManager provides the following firewall compliance reports to meet the regulatory requirements, PCI DSS, ISO 27001, SANS, NIST and NERC CIP. It also provides Security Audit & Configuration Analysis Report.
To cater to various business needs, network administrators carry out frequent configuration changes in their Cisco management process. Every single configuration change carries the risk of creating a network outage, security issue and even performance degradation. The problem becomes more complex when there are multiple devices from multiple vendors. Network administrators face a daunting task when it comes to configuration management. With ManageEngine OpManager, you can take total control of the entire life cycle of Cisco devices configuration management. . Following are some of the critical features supported by OpManager for Cisco network configuration management.
Cisco network monitoring solution with OpManager offers a integrated solution for an easy network configuration, change and compliance management (NCCCM) with comprehensive functionalities such as multi-vendor support, continuous monitoring of configuration changes, instant notifications on configuration changes, automation of repetitive configuration tasks, insightful reporting etc.
OpManager's cisco monitoring feature takes entire control of your configurations. It periodically takes backup of your configurations, baseline a configuration, revert when a faulty configuration is applied, and push configurations, from its web client itself. It does not need logging into the actual devices. It offers full history of the configuration backup.
Faulty configuration change can bring the entire business to a halt. OpManager's cisco monitor tracks the configuration for changes. If any unauthorized change is carried out, alarm is raised and the same is notified via email and SMS. It also includes a change approval board for reviewing and approving configuration changes.
OpManager's cisco monitor helps administrators to define and enforce standards. The standards could be anything - ensuring the presence or absence of certain strings, commands or values. It will scan the configuration for compliance to the rules/ policy defined and report violations. Reports on policy compliance and violations are generated.
All actions performed by the OpManager users are properly recorded as audit trails. Information on 'who' changed 'what' and 'when' can be easily deciphered. This will ensure accountability for actions in the organization. Also OpManager presents the information on the entire network configuration management process in the enterprise in the form of comprehensive, informative reports.
The biggest challenge for any administrator is to find out the occupied and free ports of a switch. It further extends to finding out what devices are connected to which port. This helps them to take informed decisions or carryout maintenance without much effort. OpManager's cisco port monitor simplifies this by discovering the devices that are connected to the switch port as well. It also provides visibility into MAC, VLAN, status, and availability of ports.
OpManager's cisco port monitor provides Cisco network mapping with an option to include mapping of physical ports to switch ports. You can provide the mapping of the physical ports and switch ports in a CSV file, which can be imported into OpManager. OpManager's cisco monitor automatically retrieves the VLAN details, Virtual IP Addresses of a device, and detects all the devices connected to a port.
OpManager's cisco monitoring feature allows to create different groups based on the location or building. The Switches can seamlessly be moved within groups anytime. Switches in different groups can be scheduled to run at different times. Whenever a switch is mapped, the results are automatically published as a csv file that can directly be opened in Microsoft Excel. OpManager also offers full history of a switch port which helps administrators to get the details of the devices that are connected to a port in the given period and vice versa.
When it comes to managing the switch ports, auditing is utmost important to know who did what and when. OpManager's cisco monitoring feature logs all the events performed using the tool with the name of the User and the date and time of the event. This helps administrators to track and audit the changes made.
In most cases, administrators might also want to get the current status of the switches. From the port details view, they can perform the following actions:
 Recognized as a May 2019 Gartner Peer Insights Customers' Choice for Network Performance Monitoring and Diagnostics Software
  Recognised as an April 2019 Gartner Peer Insights Customers' Choice for IT Infrastructure Monitoring Tools.
  Network Management and Monitor Vendor of the Year 2018, 2019
  Entered the 2019 Gartner NPMD Magic Quadrant.
  Ranked #2 in the Infotech Research Software Reviews Data Quadrant 2018.