In today's complex, dynamic network environment, server administrators work on a wide range of operating systems depending on their requirements. The operating system is the base system software that manages hardware and software resources. It is the interface between the hardware and the different applications you run. It is crucial to keep the operating system updated and most important of all, you need to ensure there is an effective network monitoring software in place to monitor the vital aspects of an operating system.
OpManager is an agentless network monitoring software that is compatible with a wide range of major operating systems (Windows, Linux, etc.) to virtual solutions like VMware, Hyper-V, etc. OpManager is highly customizable, easy to set up, and offers a wide range of custom monitors (operating system monitor) to effortlessly monitor every aspect of your operating system. Once set up, you can use OpManager for advanced OS performance monitoring - to monitor your system metrics, processes, service states, performance, logs, and services of your operating system, apart from all your network devices.
OpManager acts as a Windows OS monitor by employing SNMP and WMI protocols to monitor its various metrics. It also supports custom SNMP MIBs that can be used to monitor the availability and performance of Windows services and processes.
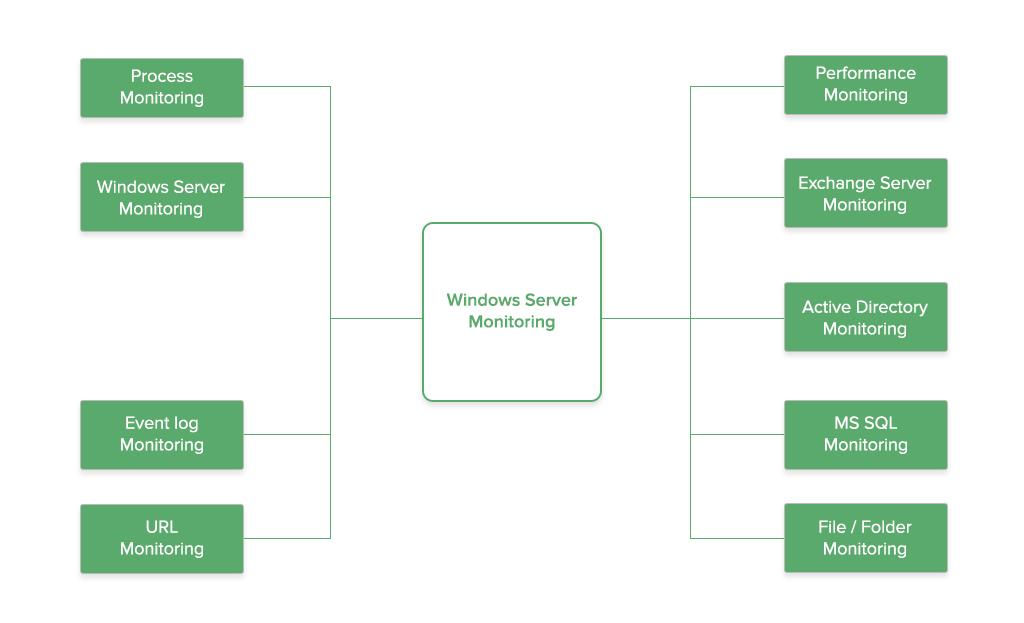
In the Windows operating system, some services and processes run in the background. OpManager offers advanced Windows service monitoring using WMI that allows you to monitor services across multiple servers on the network. OpManager's Windows process monitoring template allows you to manage the process across multiple servers and configure thresholds that alert you instantly on the breach.
Windows event logs contain critical information for diagnosing operating system failures, application, and system health, and critical events that affect the functioning of a network. OpManager allows you to monitor Windows event logs effortlessly by providing automatic rules using which you can configure thresholds and automatically assign severity levels that can be converted into alarms.
In a Windows operating system, monitoring the availability and the database of an Exchange server is critical to prevent the delay of messages being sent or malfunction of email servers. OpManager's predefined Windows network operating system monitoring tool allows you to monitor the CPU, memory, and disk space of Exchange servers with specific details regarding the mailbox ranging from one to multiple users. With threshold support and real-time performance reports, take control of your Exchange servers with OpManager.
Windows Active Directory process includes services, domain controller services, and critical processes related to resource allocation. It contains important information related to network resources. Using OpManager, you can monitor CPU usage, RAM, file Reads and Writes, and also network counters like Connected users, LDAP Client Sessions, Searches, and Bind Time as well as performance counters like NTLM and Kerberos Authentication.
Linux, being an open-sourced monitoring system is widely used by server administrators. It is also secure and more efficient when it comes to utilizing system resources. OpManager provides extensive Linux operating system monitoring by offering many predefined Operating System Monitor for monitoring the usage of resources, workload, memory, and disk utilization of Linux servers. You can also monitor the network and process count with comprehensive insights into the temperature and critical Linux server components. With OpManager's custom thresholds, you can automatically assign severity to your alarms and troubleshoot operating system issues before they are detected by the end user.
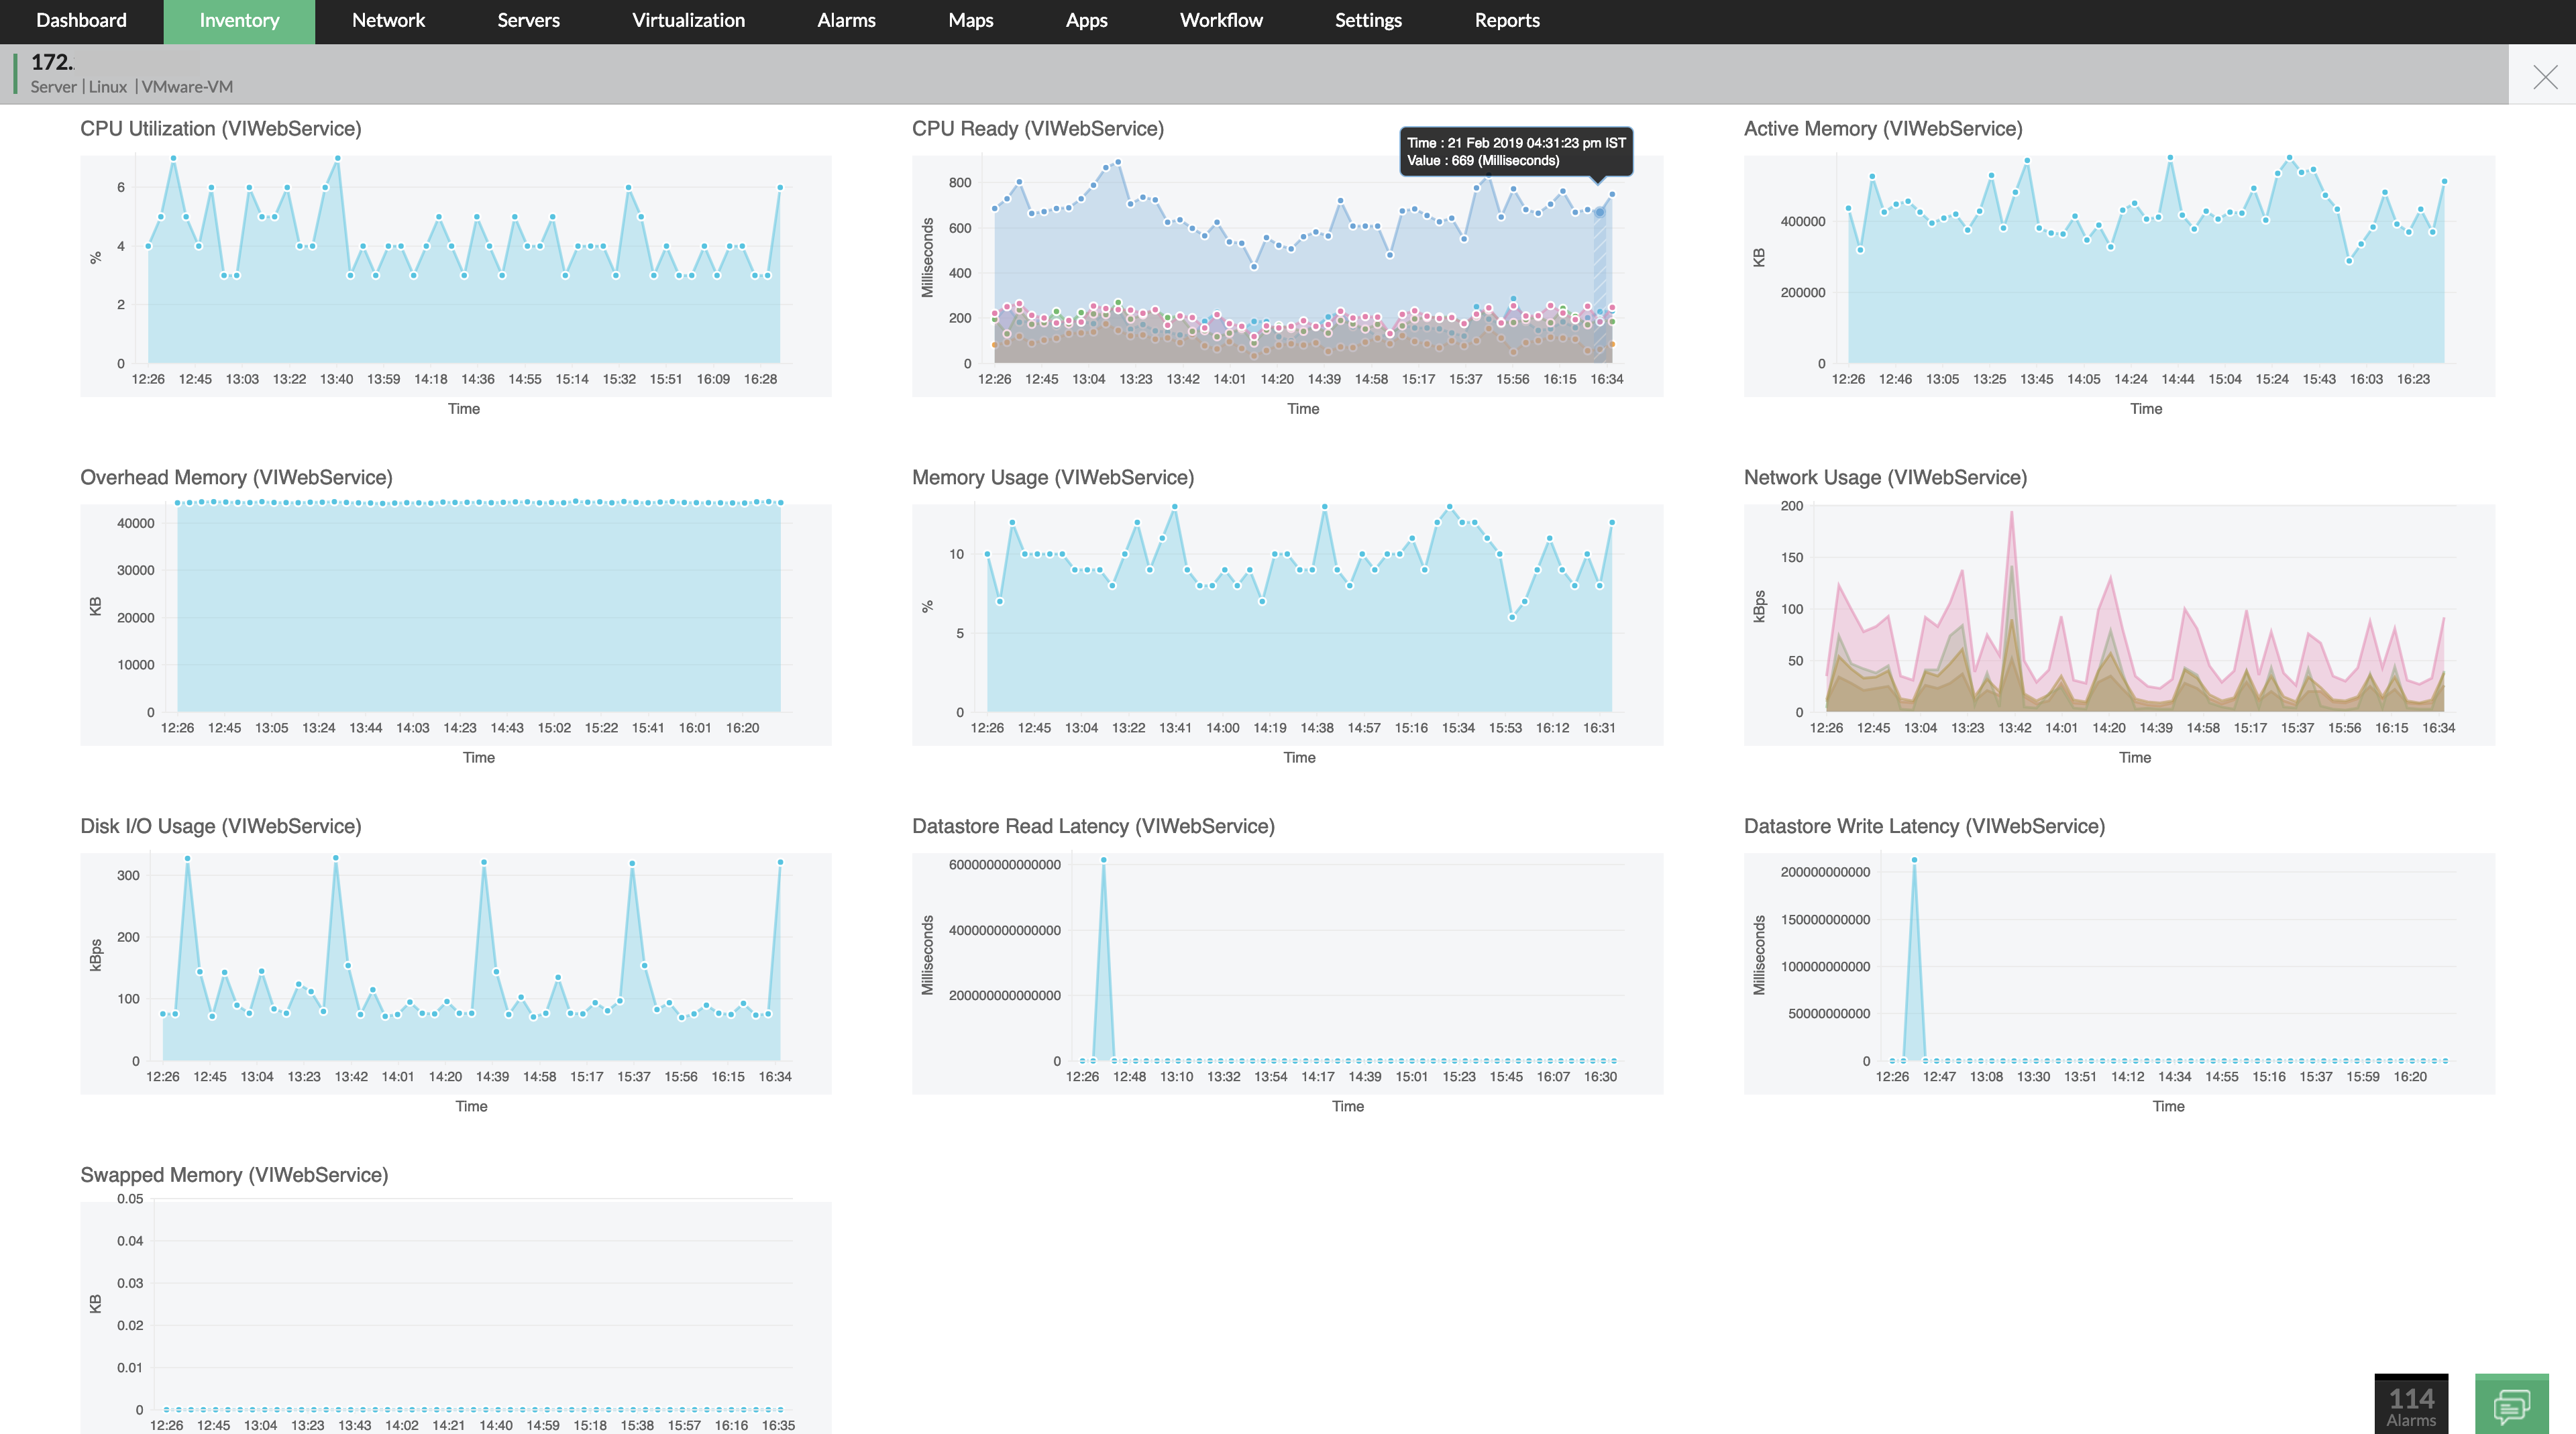
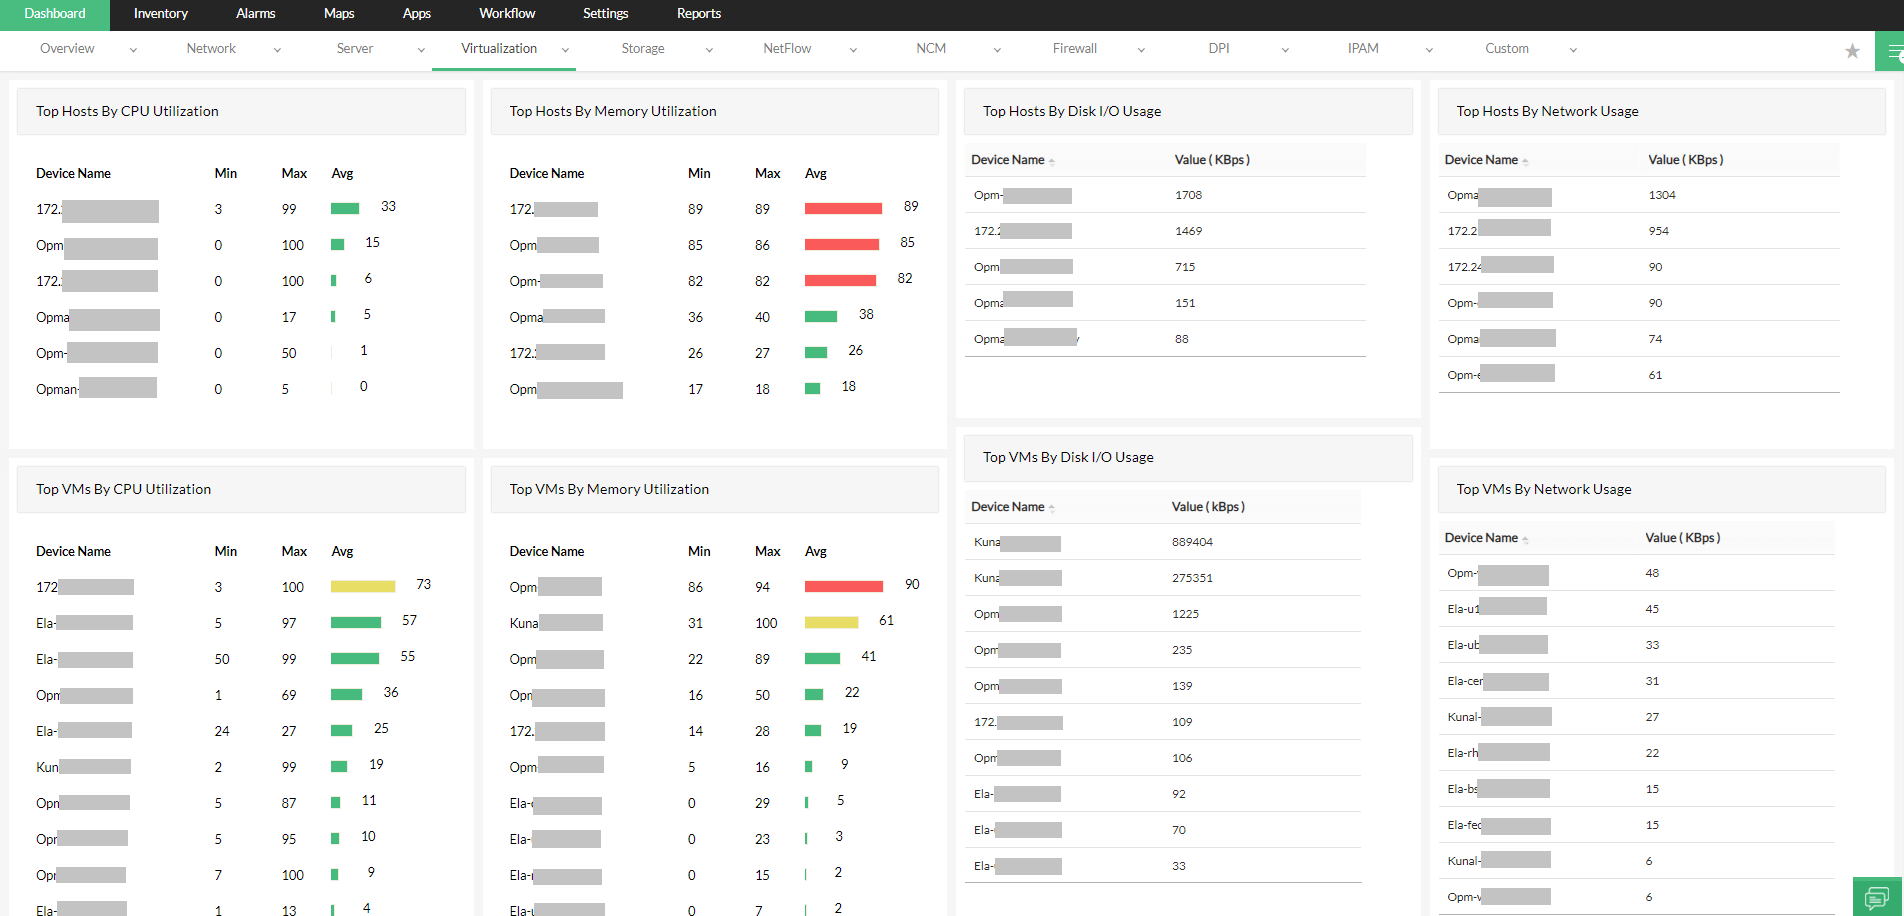
A virtual environment consists of VMs with separate operating systems and applications each with individually specified memory, storage, and computing resources. OpManager offers comprehensive monitoring of VMware vSphere, Microsoft Hyper-V, or Citrix Xen host and associated virtual machines in real time. OpManager automatically discovers and maps VMs in a host and provides exhaustive reports based on performance, availability, health, and also capacity. With OpManager's custom virtual operating system monitor, you can monitor parameters like free physical memory, page faults, page reads, page writes, pages per second, available page-file memory size, available physical memory, and available virtual memory.
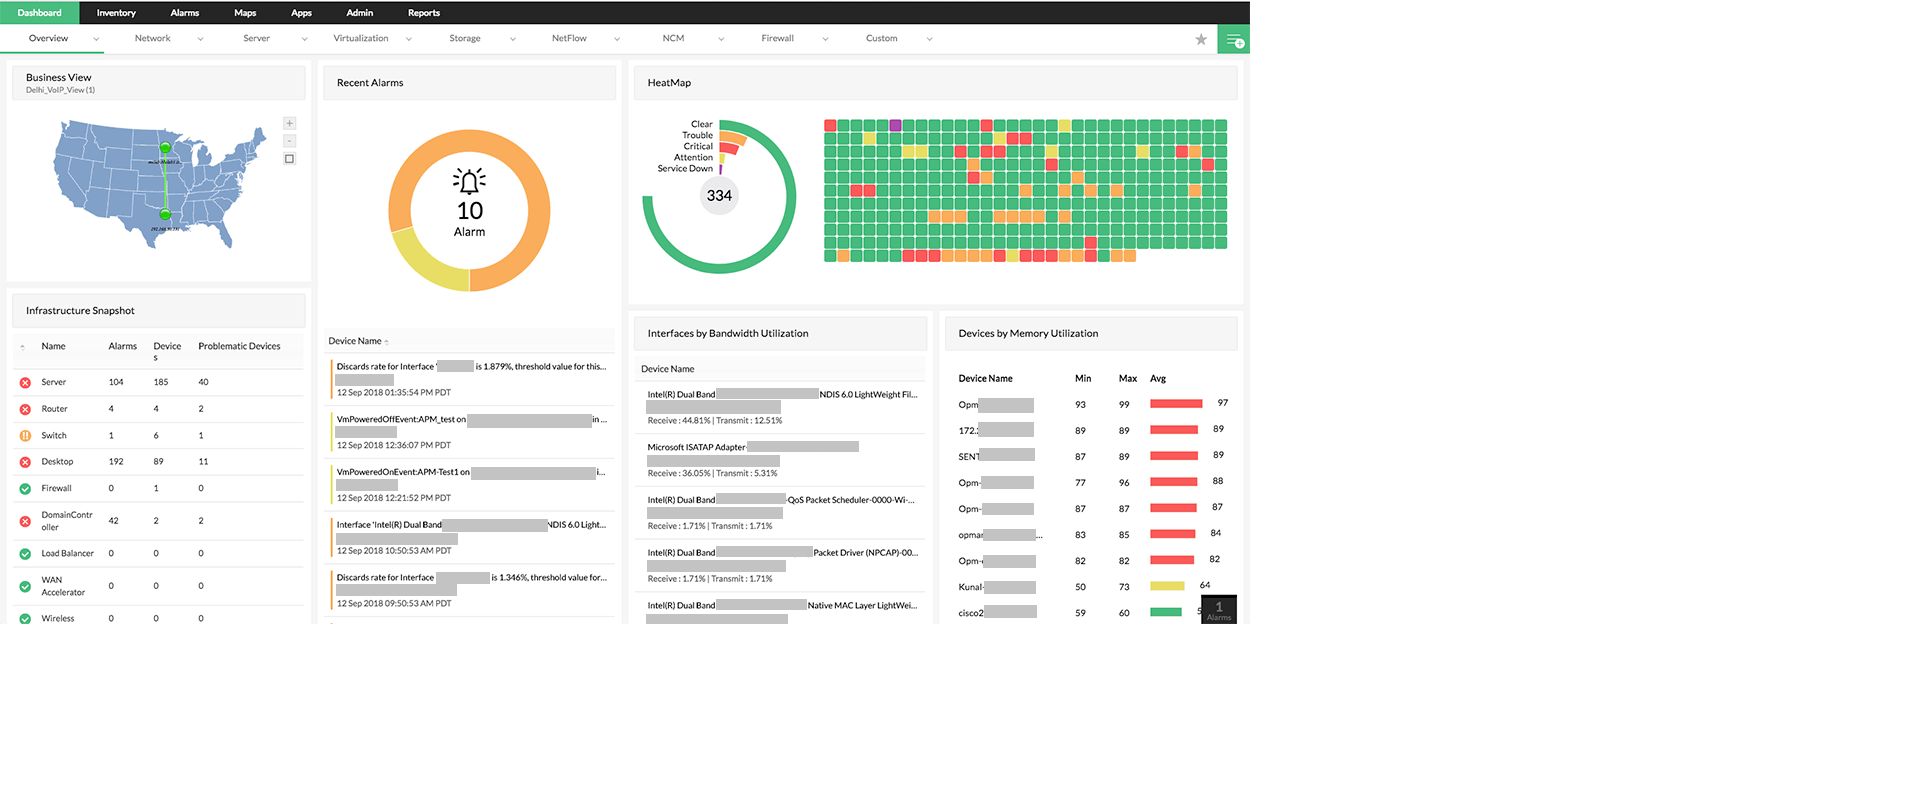
An important aspect of all OS monitoring tools is being able to collate metrics across all monitoring platforms on a single screen. OpManager's customizable dashboard allows you to display the performance stats and critical metrics across all your operating systems in a single view using widgets. OpManager offers over 100 custom widgets that include top 'N' widgets, reports, and graphs that let you take control of your network irrespective of the operating system used.
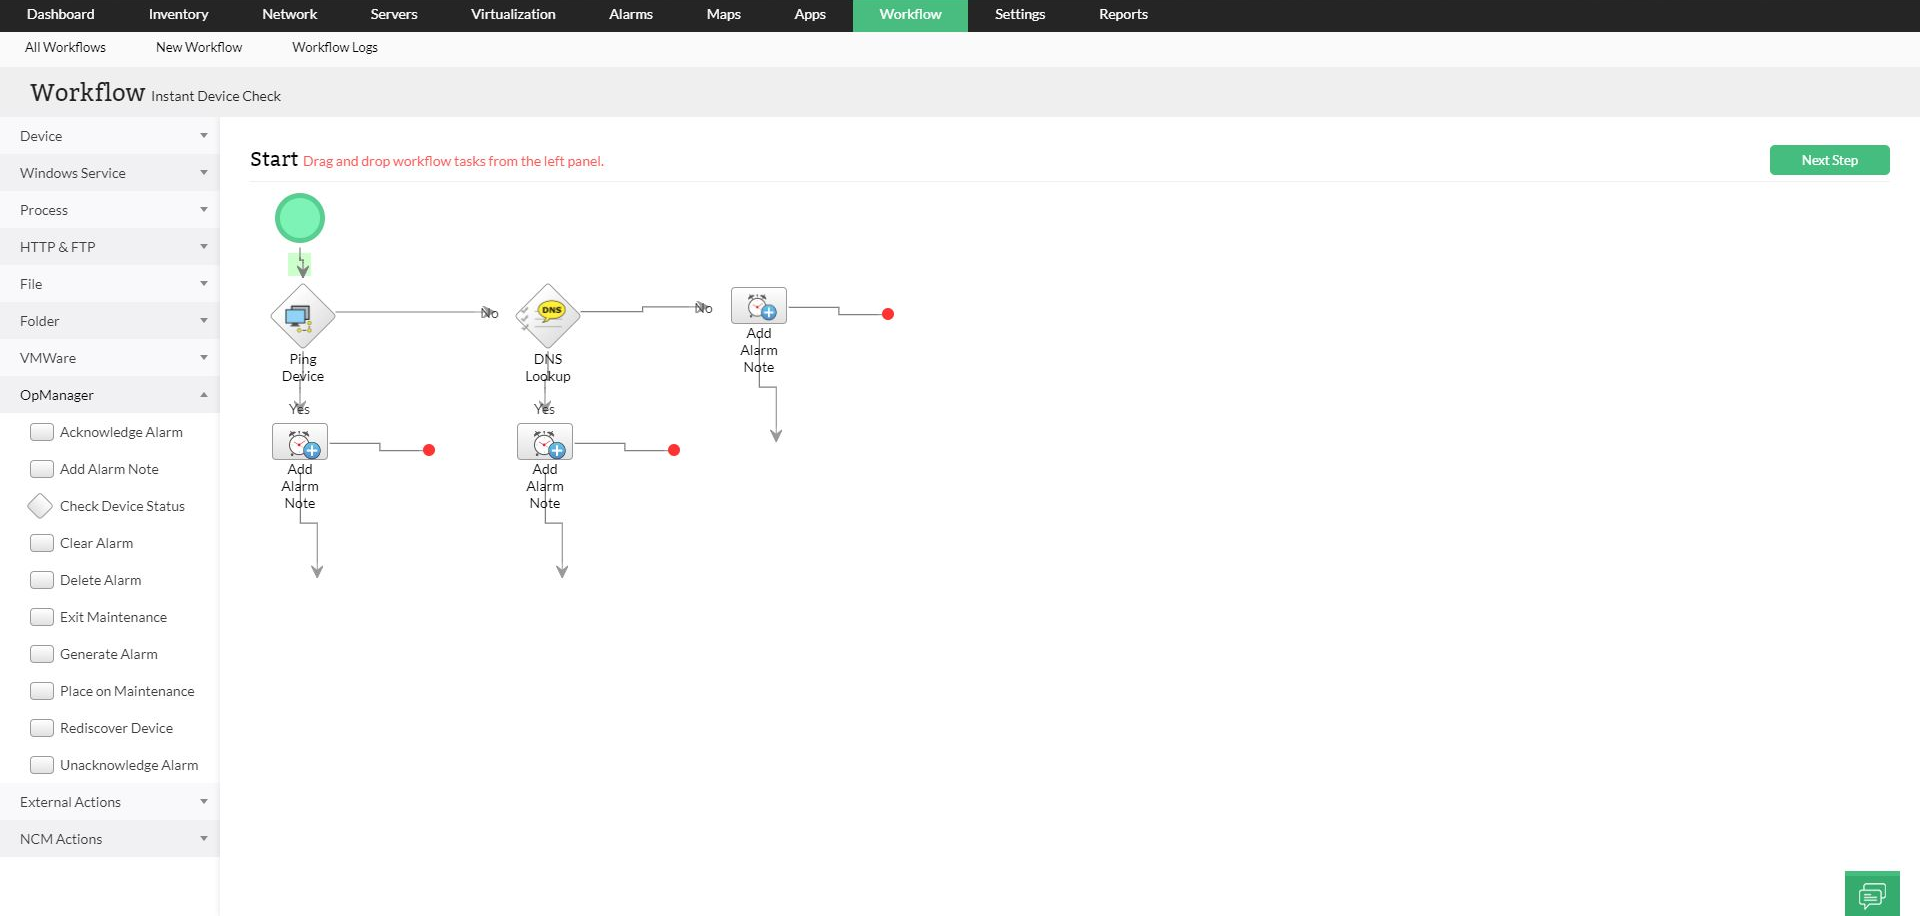
OpManager's Workflow feature allows you to automate the process of operating system management. With over 70 workflow actions, you can set up custom workflow rules using the drag-and-drop Workflow builder and eliminate the use of complex scripts and codes to automate IT. These include automating files and folder management, and URL management with options to automate Windows services and processes. You can trigger external actions or even run a script when a fault is detected using OpManager's Workflows.