Switches are the backbone of your LAN. Any problem in your switches affects most of your LAN users. Switch monitoring is essential to maintain your network in a healthy state. It is crucial to monitor the hardware as well as the traffic through the switch. Network switch monitoring consists of switch port monitoring and mapping, switch performance monitoring, and switch traffic monitoring. There are separate tools available for each of these functions such as switch port monitoring software, switch traffic monitor, switch port mapper, etc. However, using multiple tools for monitoring switch becomes an annoying task for the IT admins as the tools require:
It is always better to have a unified switch monitoring software or switch monitoring tool that can accomplish all these tasks. Also, implementing a proactive network port monitoring system helps you detect problems early and avoid potential network pitfalls.
ManageEngine OpManager is a comprehensive network switch or port monitoring software. With OpManager, you can monitor switch availability, health, and performance. OpManager's switch port monitoring functionality automatically discovers switches in your network and intuitively places them on a port view.
Using OpManager's switch monitoring capability, operators can gain visibility into the status and availability of switch ports. OpManager actively monitors switch ports and quickly notifies operators whenever a switch port or the switch goes down. Operators can setup OpManager to monitor only critical ports, an industry best practice for switch monitoring, that prevents unnecessary alarms from being generated. OpManager also offers visibility into spanning tree status showing which ports are blocked and which ones are forwarding. You can also bundle OpManager with NCM and OpUtils to perform dedicated configuration management and port monitoring.

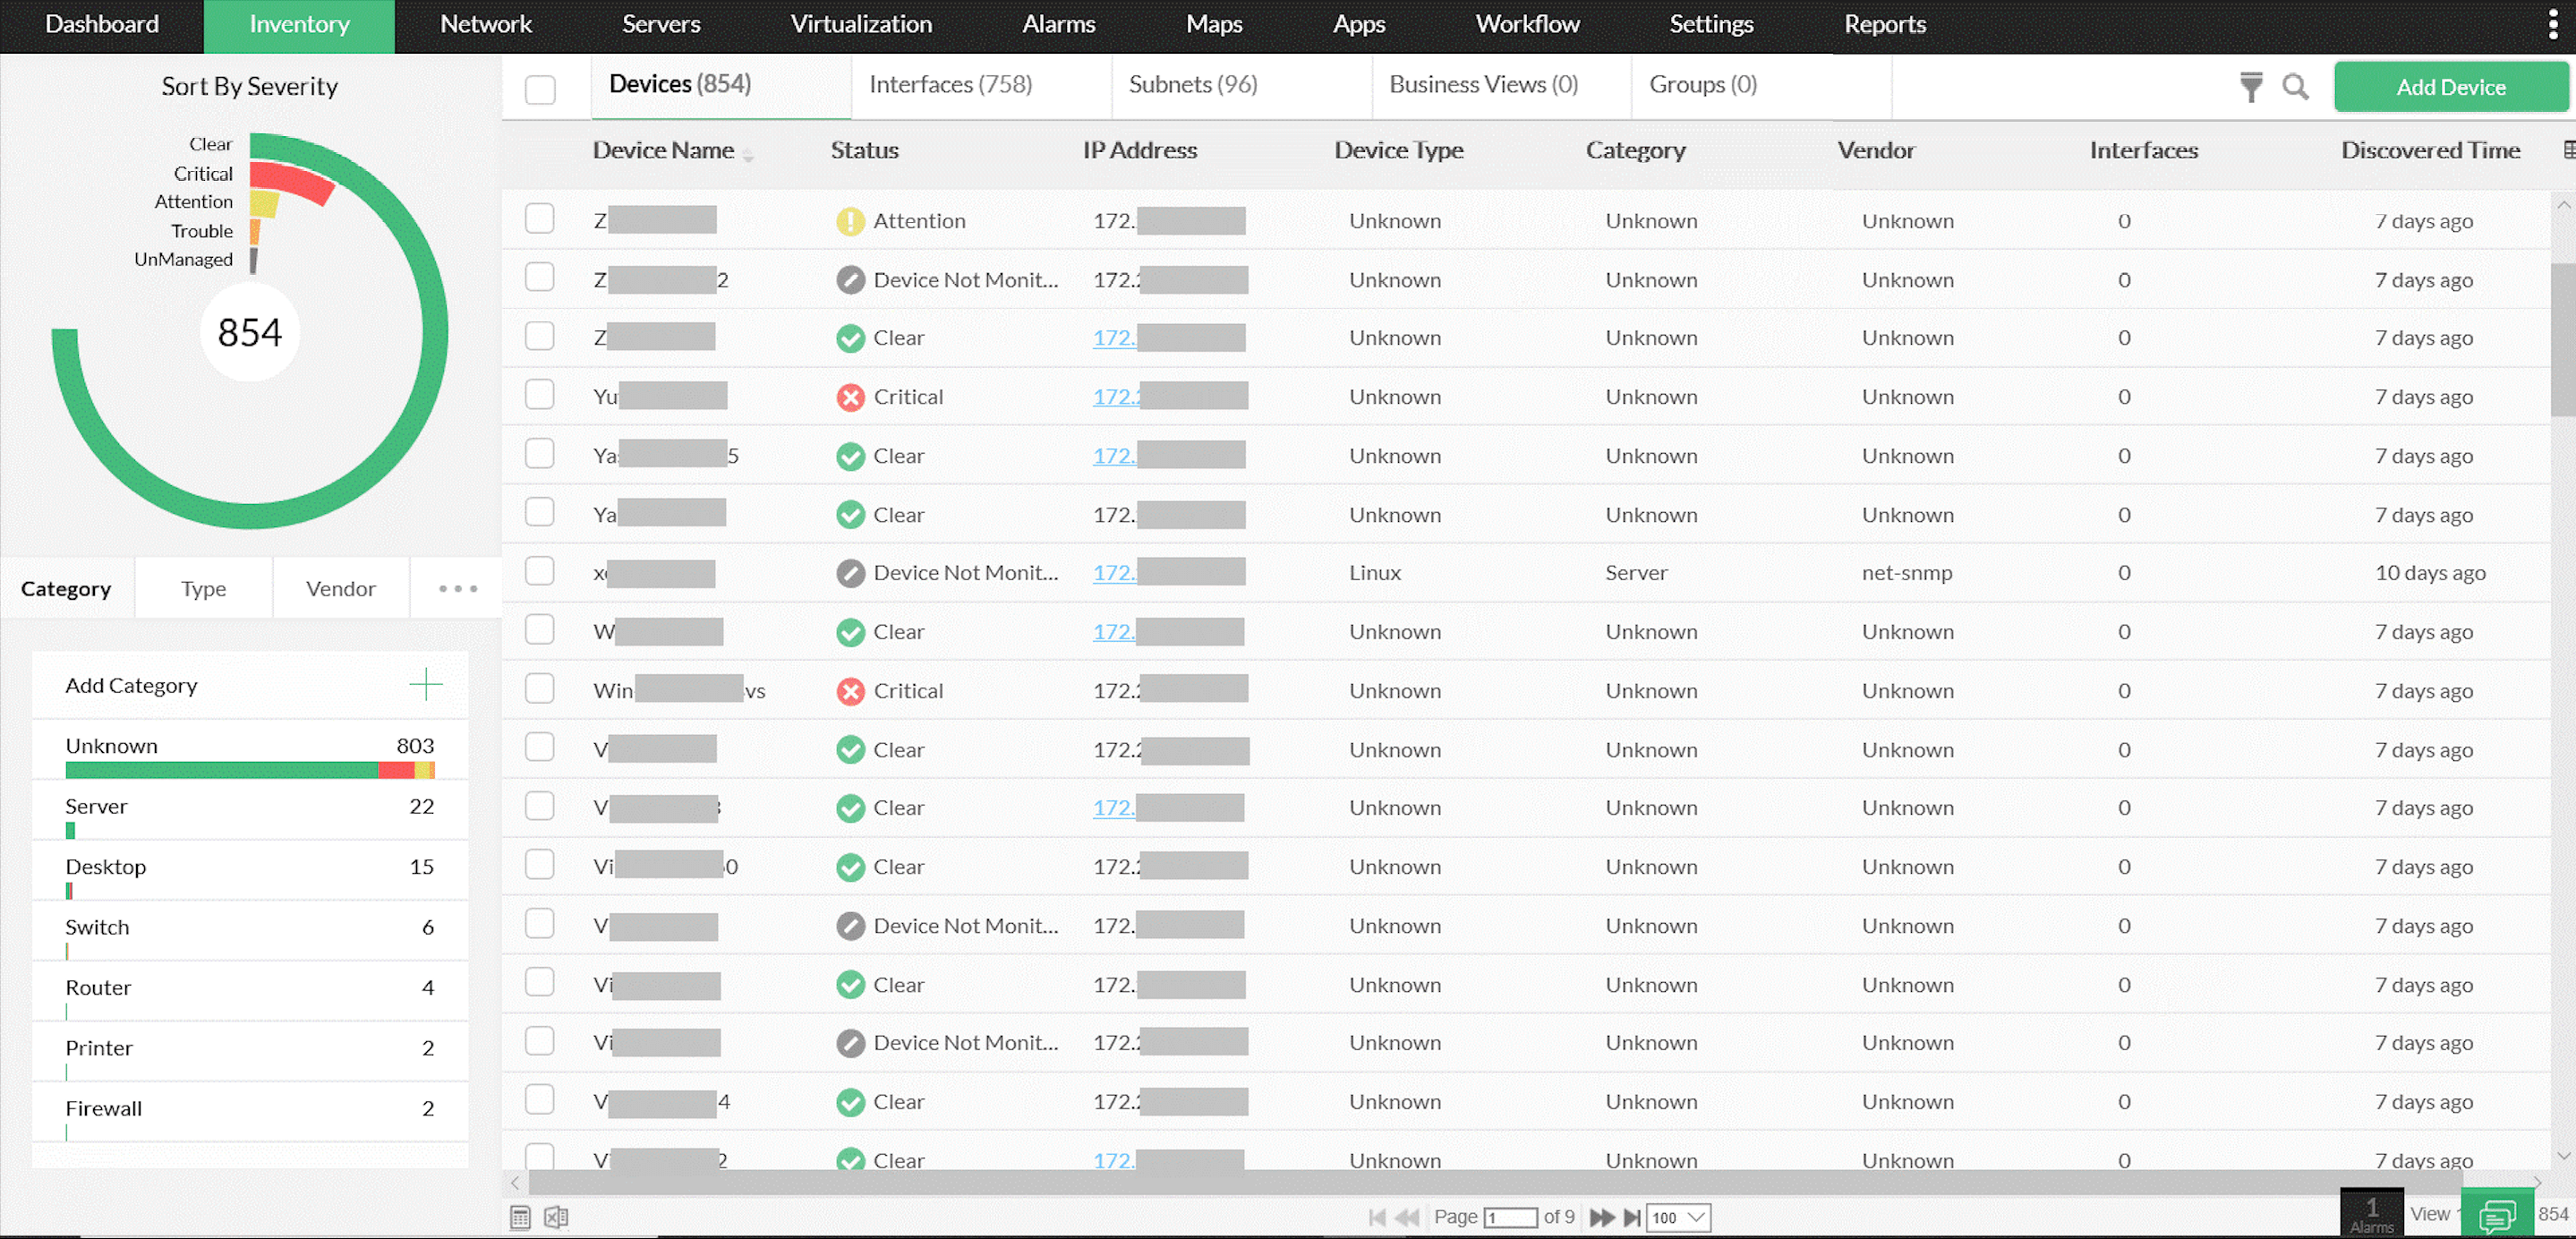
With OpManager's network port monitor, you can create network maps in business views to graphically visualize your entire LAN. OpManager can automatically send alerts when a link goes down.
OpManager's reporting functionality also provides you with a detailed availability report of your switches and switch ports. You can use these reports to ensure that your SLAs are being met.
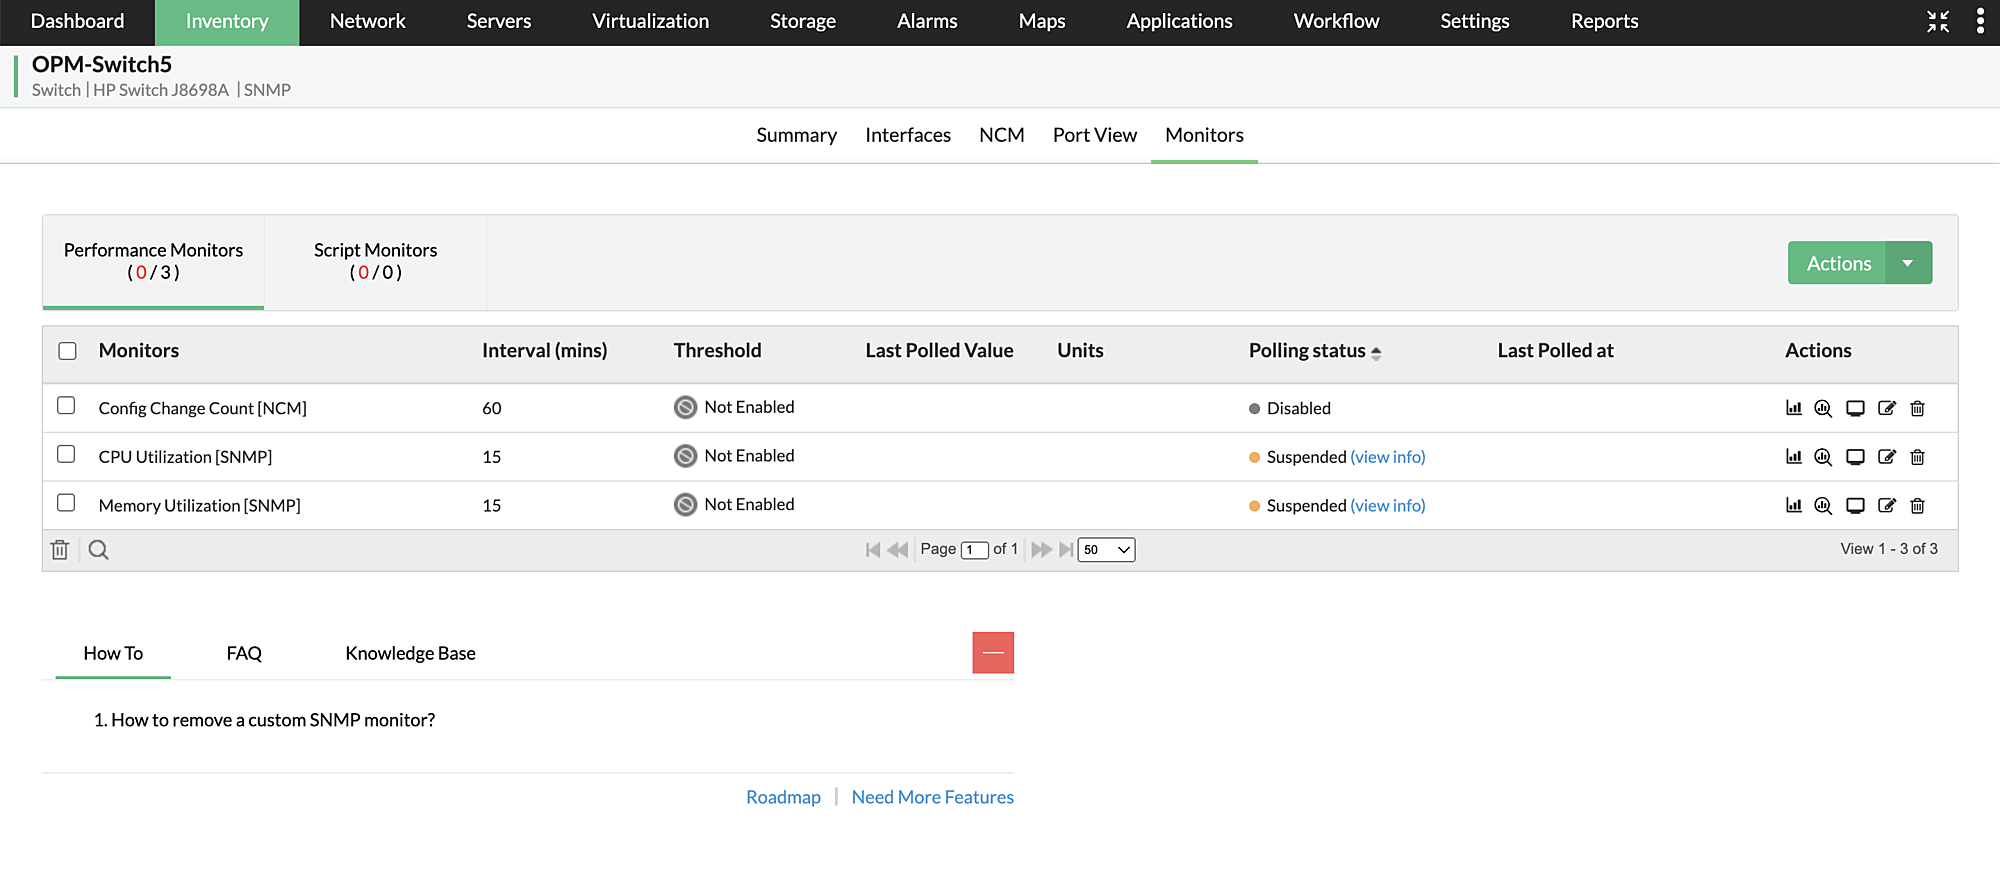
OpManager comes with several performance monitors to keep the switches performance in check. With switch performance monitoring, you can monitor critical switch performance metrics such as IP routing discards, CPU cost rate, Total current buffer, jabber packets, undersize or oversize packets, drop events stats and more. Along with vendor monitors and RMON monitors, you can also create custom monitors to scrutinize switch and their performance metrics with SNMP support.
OpManager helps you monitor and troubleshoot network switch ports for traffic, utilization, errors and Service Level Agreement (SLA) verification. By presenting accurate information on port traffic and utilization, OpManager helps you identify top talkers on the LAN.
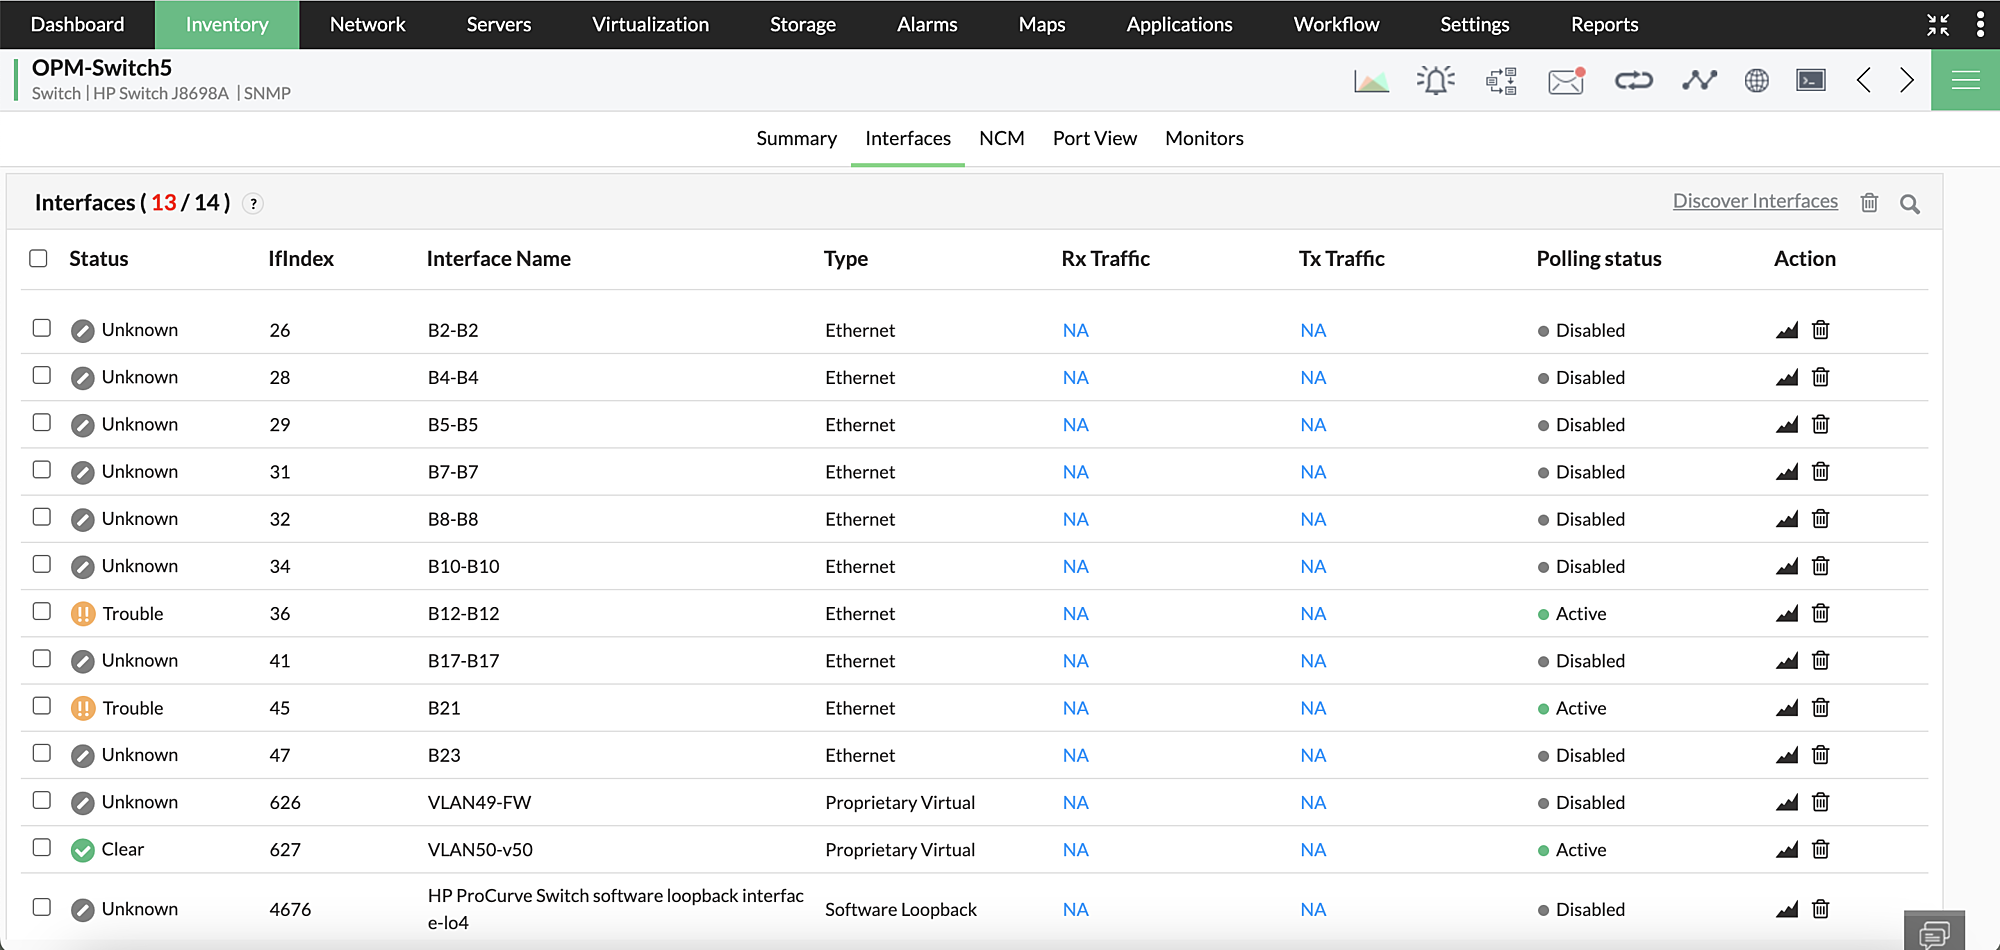
Switches can have numerous interfaces, making switch monitoring difficult. OpManager comes with dedicated interface monitoring that discovers and monitors each and every interface present in the network switches. OpManager's interface monitor scrutinizes and features in and out speed of each interface. It also displays the availability status of interfaces along with the admin status and operational status so that you'll know whether the interface is up or down.
Leverage OpManager's proactive alerting mechanism to instantly identify faults on network switches. OpManager performs threshold based monitoring so when threshold level of a switch breaches, OpManager finds it as a faulty device and instantly notifies network admins. This alerting can be done through various notification profiles such as SMS, Email, slack, ticket logs and web alarms.
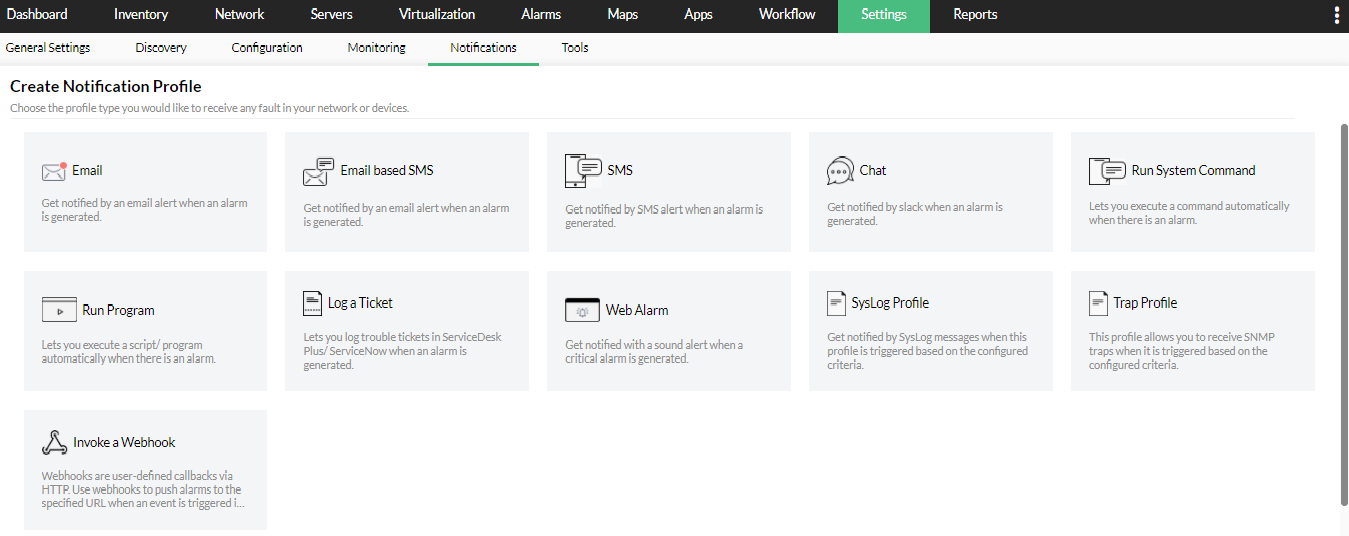
You can also configure to automatically run a command or program, when a particluar fault arises, eliminating the need for network admins. For cases where a network admin is busy with critical tasks, or when an alarm goes unattended, you can configure to escalate those alarms to an alternate person.
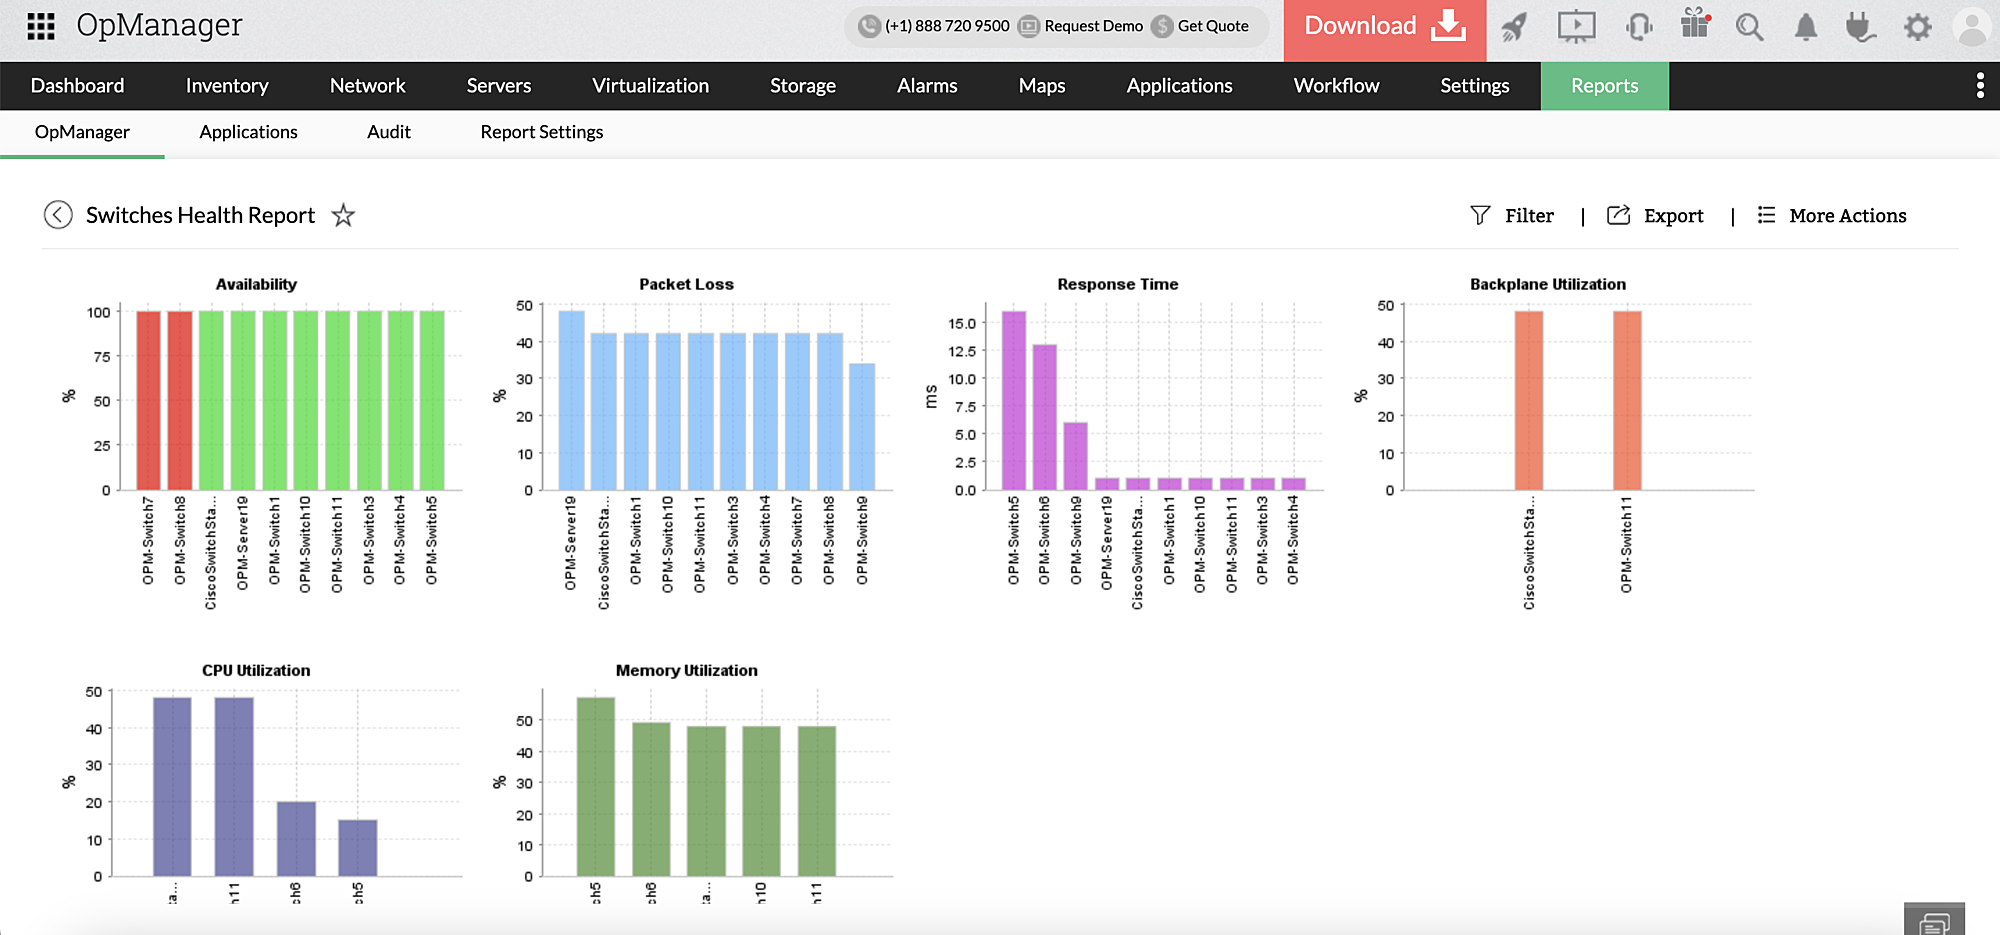
OpManager offers more than 100 intuitive reports on health and performance of its network devices. It collects and stores data of switches in the form of graphs that helps network admins easily understand critical metrics at different intervals of time. For instance, report on "Switch health" displays graph on switch availability, packet loss, reponse time, backpane utilization and other performance metrics. You can also choose to export or schedule these reports as you require.
Real-time switch monitoring tools such as Switch Port Mapper and STP Tool are bundled with OpUtils add-on in OpManager.
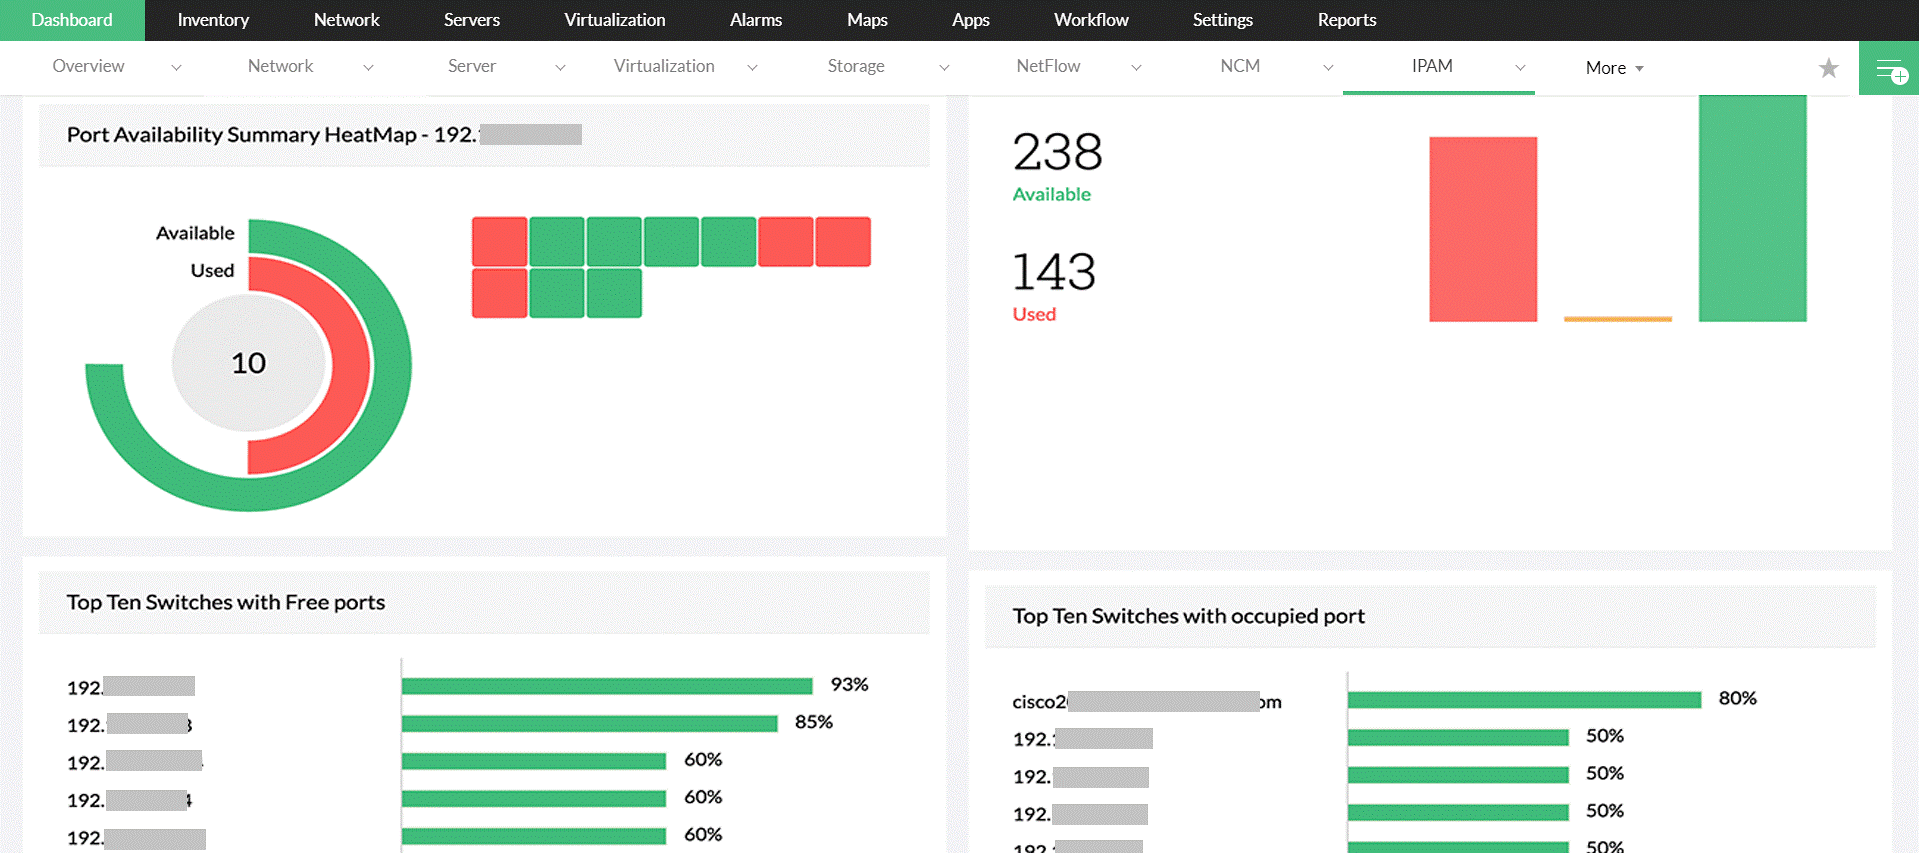
The Switch Port Mapper is a useful utility that is embedded in OpManager. It helps you to quickly find out the list of devices connected to the switch ports.
Spanning Tree Protocol details for each port can be viewed using the STP Tool. This gives you valuable information about the spanning tree state of each port such as which ports are blocking and which ports are forwarding etc.
Learn more about OpManager's switch port management here.