Monitoring memory usage is essential in ensuring maximum performance. High rates of memory utilization result in decreased performance for the associated processes. In addition, a steady increase in memory utilization over time may indicate a memory leak. A memory leak is when processes allocate memory as they start, but is not released when they end. Memory leaks degrade device performance over time. Typically, the device becomes unresponsive when memory is no longer available.
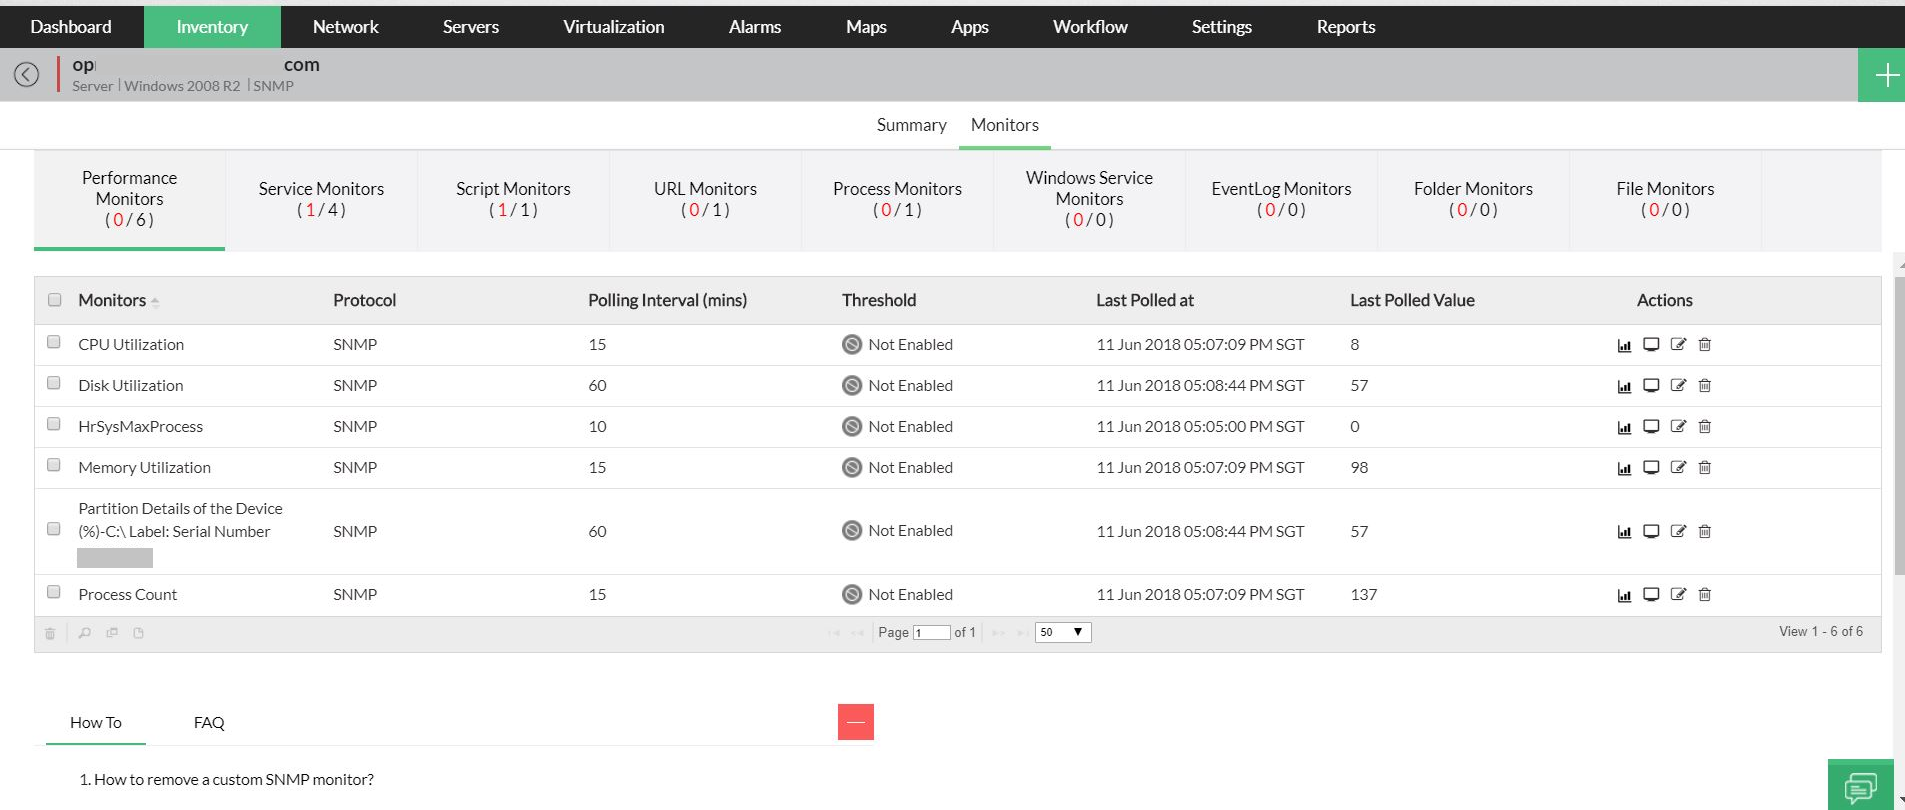
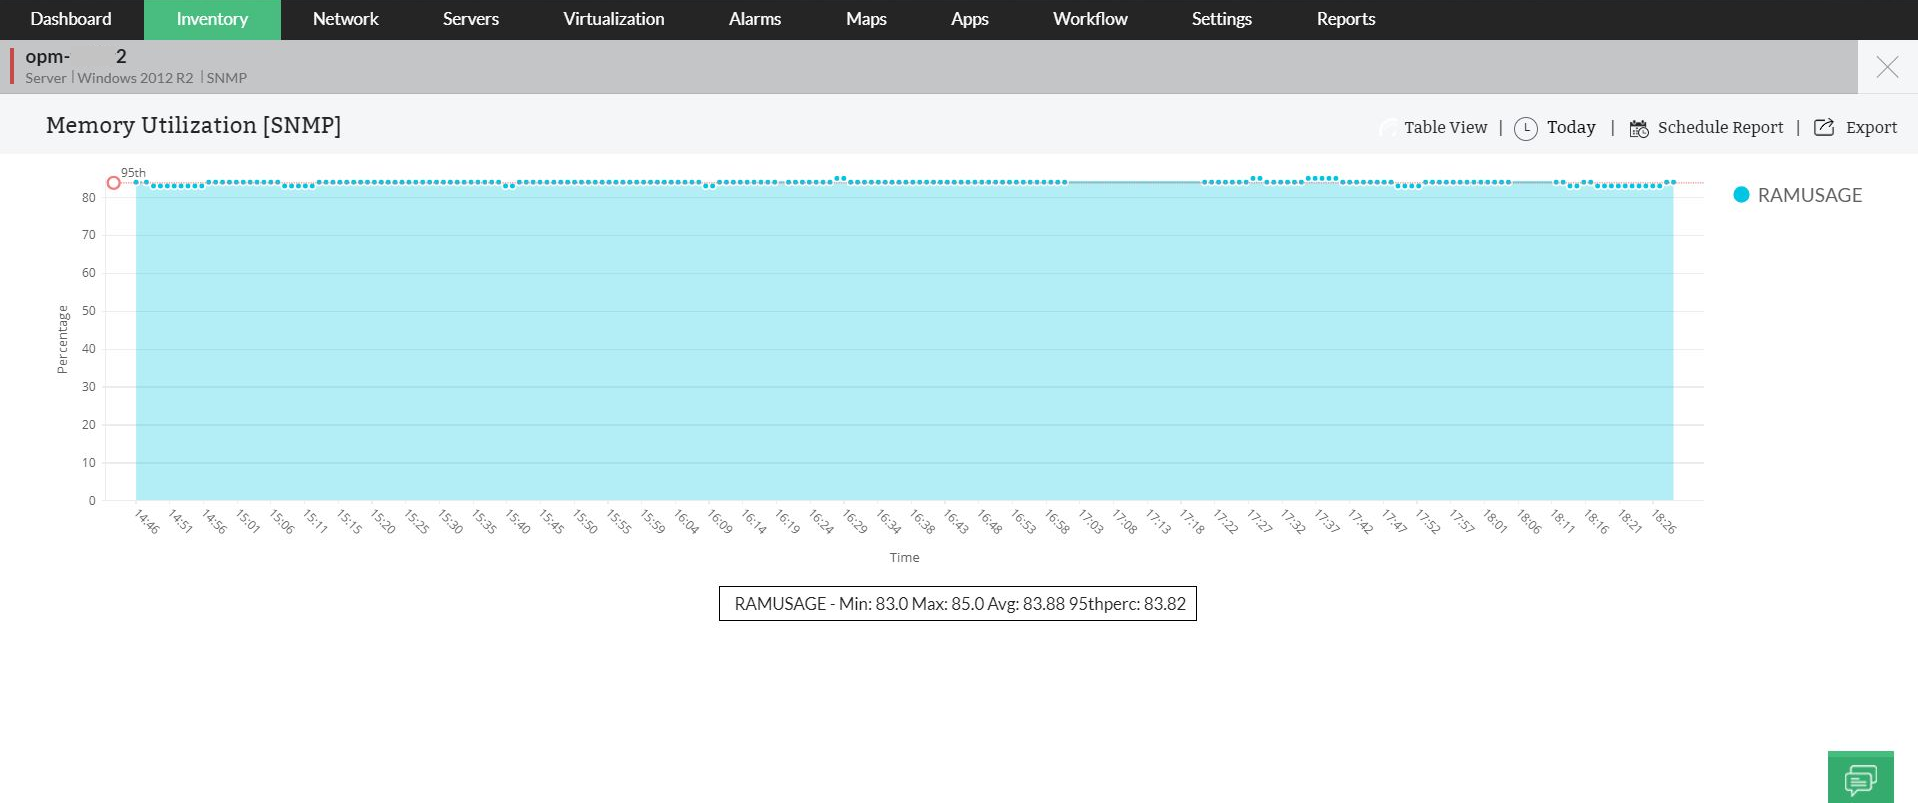
Memory monitoring software helps keep track of the free memory available. Memory use is tracked so that unexpected changes in usage can be detected, analyzed, and corrected. Memory monitoring tool monitors proactive memory usage with the help of highly customizable reports to provide in-depth insights into your memory usage. Accessing this information helps ensure memory utilization issues won't hinder your application availability or performance, and provides a more satisfactory end-user experience. Memory utilization is the average utilization derived from the percent of available memory in use at a given moment.
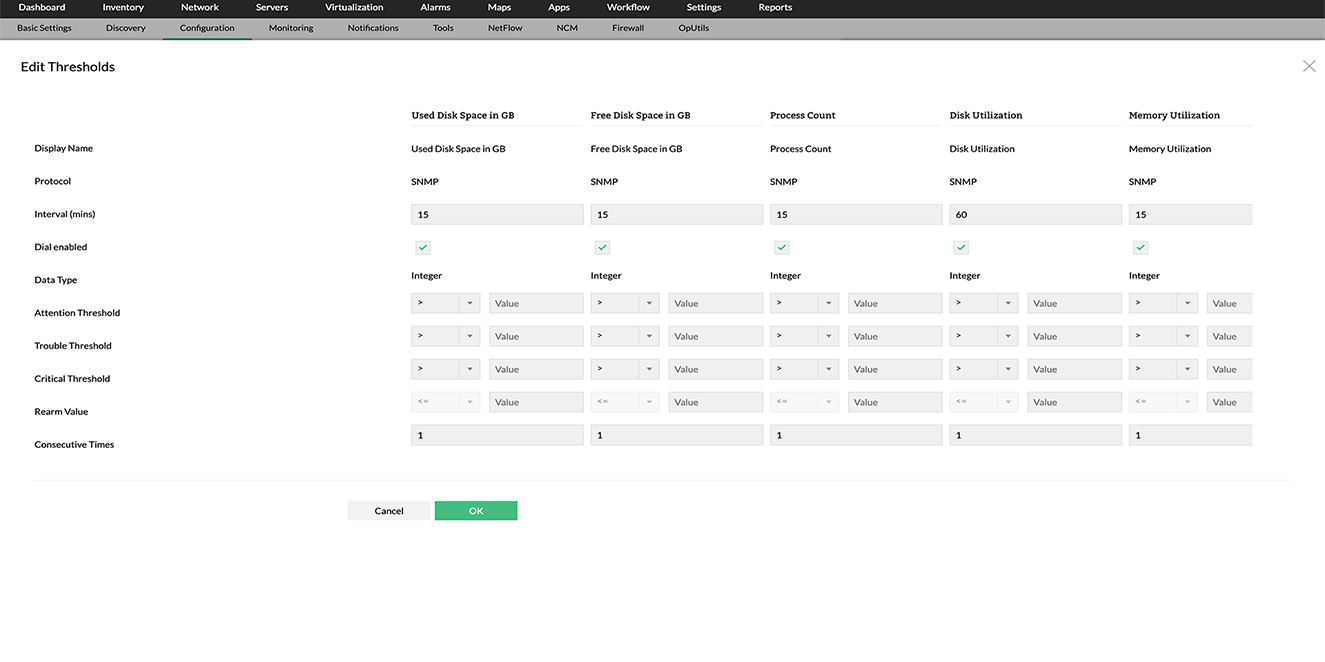
OpManager's Windows memory monitoring process monitors the memory utilization on Windows and Unix-based servers using SNMP, WMI, or CLI protocols. OpManager's memory performance monitor allows you to set memory thresholds so that you get alerted if your machine’s memory utilization reaches a critical level predetermined by you.


OpManager's memory monitor feature provides intensive, agentless virtual device memory monitoring to enable effortless performance management of your VMware devices. With proactive monitoring and extensive reporting, ensure that your virtual devices are constantly running at peak performance.
OpManager's widgets give a glance at systems that are the top consumers of memory. Also, be alerted when memory utilization crosses critical thresholds.