Active Directory depends on certain critical services for proper operation.The first step in ensuring Active Directory availability is to monitor these critical services.
Active Directory Monitor monitors the following critical services.
When any of these services become unavailable, your Active Directory Server will not be able to perform critical tasks properly.
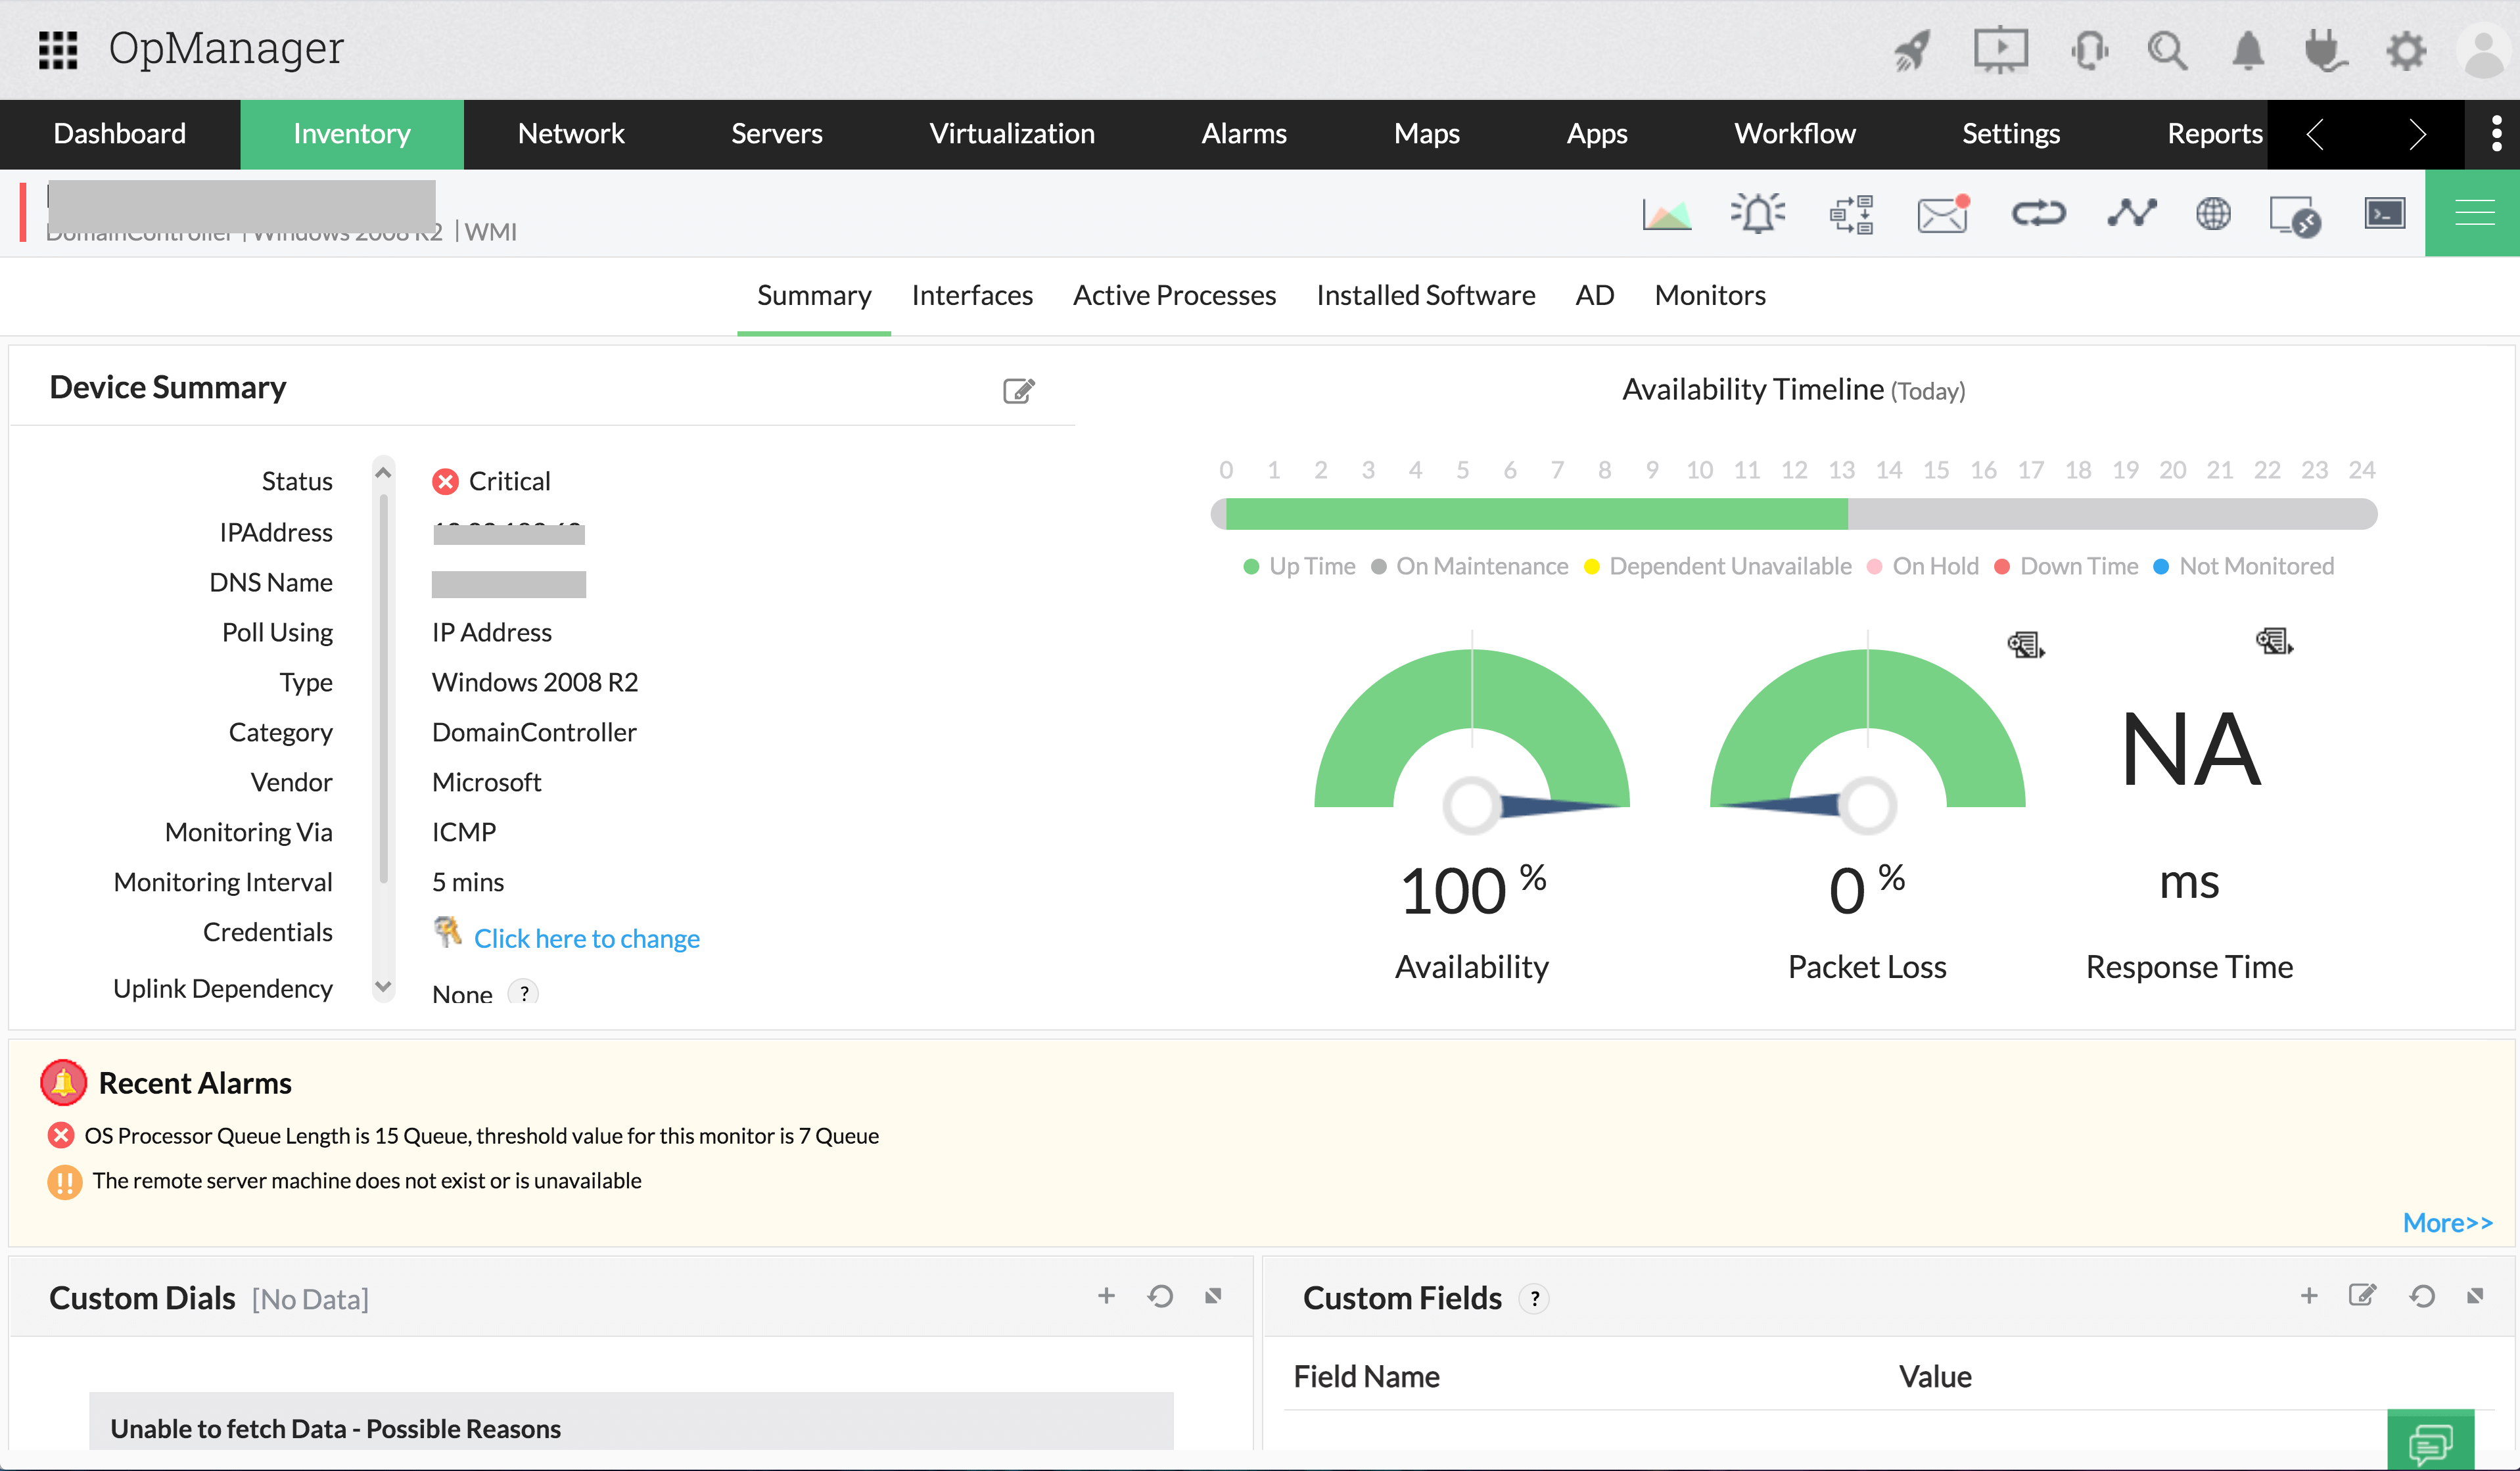
OpManager's active directory monitoring tool scrutinizes CPU, Memory and Disk Space utilization as well as Processor Queue length using WMI protocol. Operators can get both real-time and historical statistics for CPU, Memory and Disk Utilization. Using customizable thresholds, operators can be notified well in advance and thereby proactively prevent outages before they occur. You can also see the number of processes and services that are active on the system.
With OpManager's AD monitoring software, you can keep tabs on the usage of critical LSASS & NTFRS processes. Parameters monitored include CPU Usage, Physical RAM, File Reads, File Writes, Cache Hits, etc. You can also monitor critical Network counters like Connected Users, LDAP Client Sessions, & LDAP Bind Time as well as Performance Counters like NTLM Authentication, Kerberos Authentication & LDAP Searches.

OpManager's active directory server monitoring helps keep the health and performance of domain controllers in check with threshold-based monitoring. The device snapshot page features availability status of domain controller for the past week, month etc., Monitoring active directory also lets you track the health of domain controller in real-time with the information obtained from monitoring domain services (DS) and system resource usage.
You can obtain the percentage of directory reads, writes and searches from Name Service Provider Interface (NSPI), Kerberos authentication/sec, Directory and Resource Administration (DRA) and more.
When replication services fail, users find it difficult to access files and folders thus causing operational failures. With AD monitoring, you can gain insights into AD File Replication Services status, Replication Objects Applied, and Replication Objects Remaining. This helps network admins avert network functional disabilities due to replication service failure.
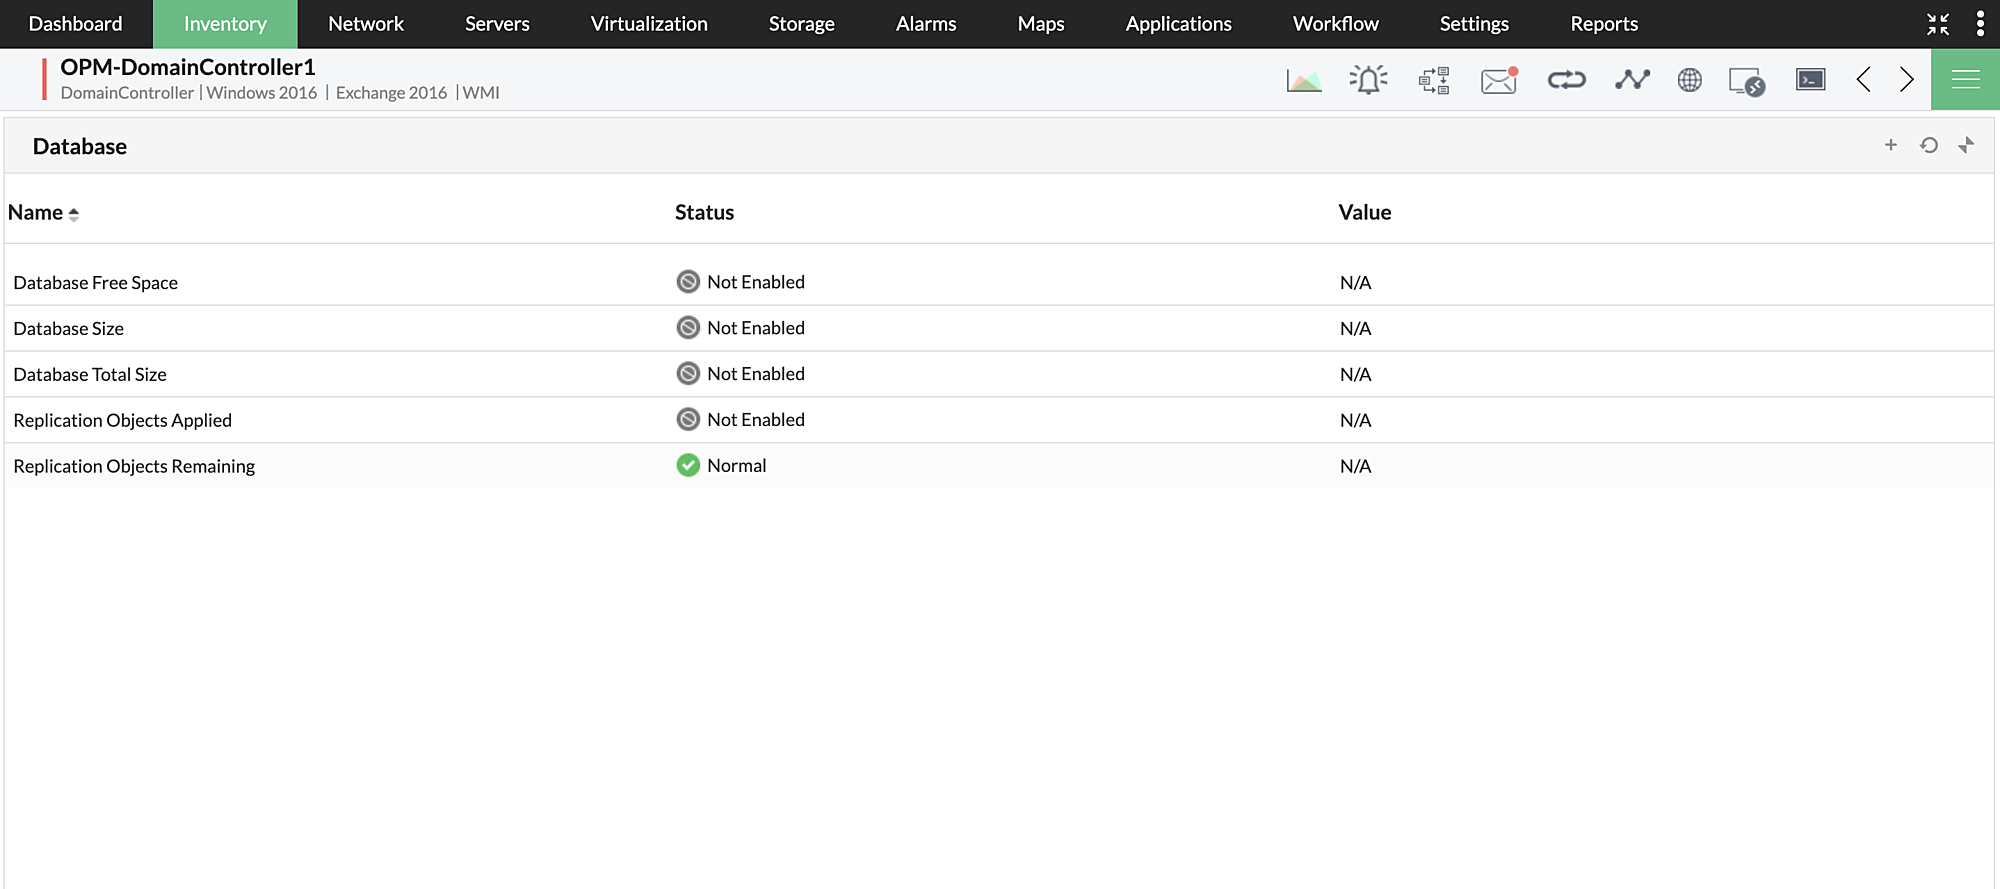
Monitoring AD database server is essential to keep a track of the runnning files in the server, and their memory consumption. This helps network admins ensure that there is enough room for the upcoming directory files and no current files would experience operational disaster either.
With this active directory performance monitoring, you can keep a track of database performance metrics such as Database Free Space, Database Size, and Database Total Size.


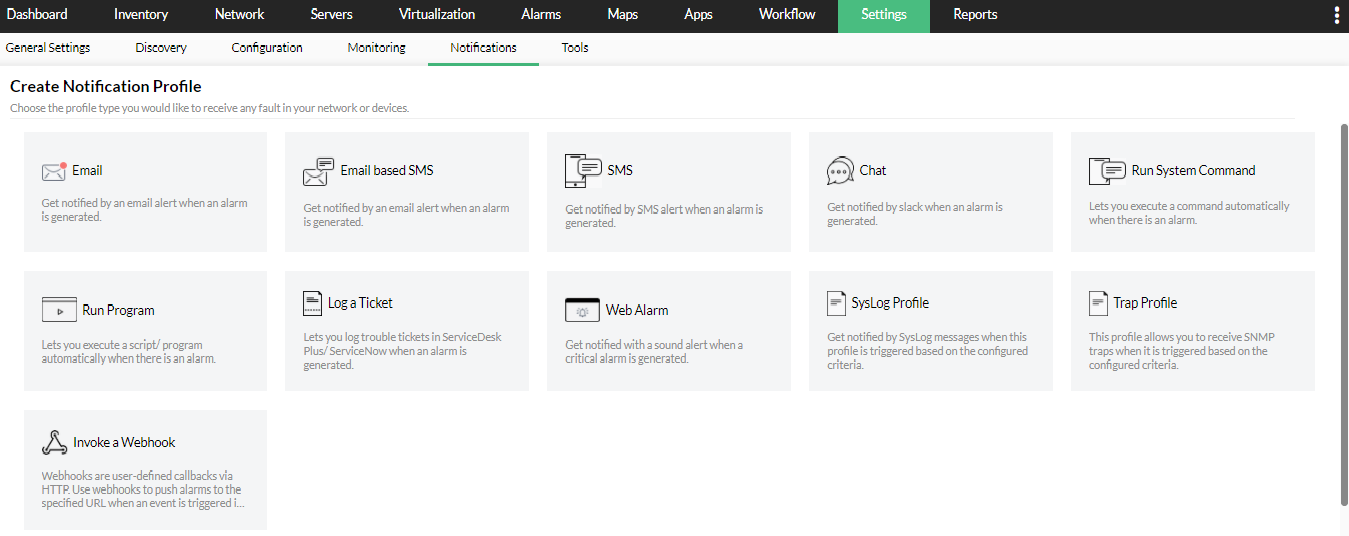
OpManager lets you create and assign notification profiles to domain controllers to instantly notify you on threshold breaches. When a monitor fails or an active directory service turns dormant, email or SMS alerts will be sent to the pre-configured IDs. You can also get notified by SNMP traps, syslog messages and more. You can find web alarms in the snapshot page of the device under the tab AD. This tab also provides a consolidated view of all the services and key performance metrics monitored in a single pane of glass. You can also configure to execute a script or program on faulty devices based on predefined conditions or even automate certain first-line troubleshooting tasks with Workflows.
OpManager's built-in server and application monitoring reports hold data of active directory files with which network admins can correlate, diagnose and troubleshoot AD performance issues. You also have options to export or schedule these reports to get a glimpse of AD performance in a periodical manner. You can also custom create new reports as per your active directory monitoring needs.
If you want to see additional Active Directory Monitoring features implemented in OpManager, we would love to hear. Click here to continue