Zia Insights in OpManager
Zia Insights in OpManager leverage AI-driven analytics to provide meaningful insights into performance metrics. These insights are available for graphs in OpManager that contain numeric values, allowing users to gain easier understanding and deeper visibility using comparison analysis, variance analysis, and other key comparisons. This help document guides users on how to access and interpret Zia Insights in OpManager.
Accessing Zia insights
- Navigate to the Inventory tab.
- Select a monitored device (e.g., a server or network device).
- Open the Graph Summary for a specific metric (e.g., CPU Utilization, Memory Usage).
- Click on the Zia Insights icon to view AI-generated insights.
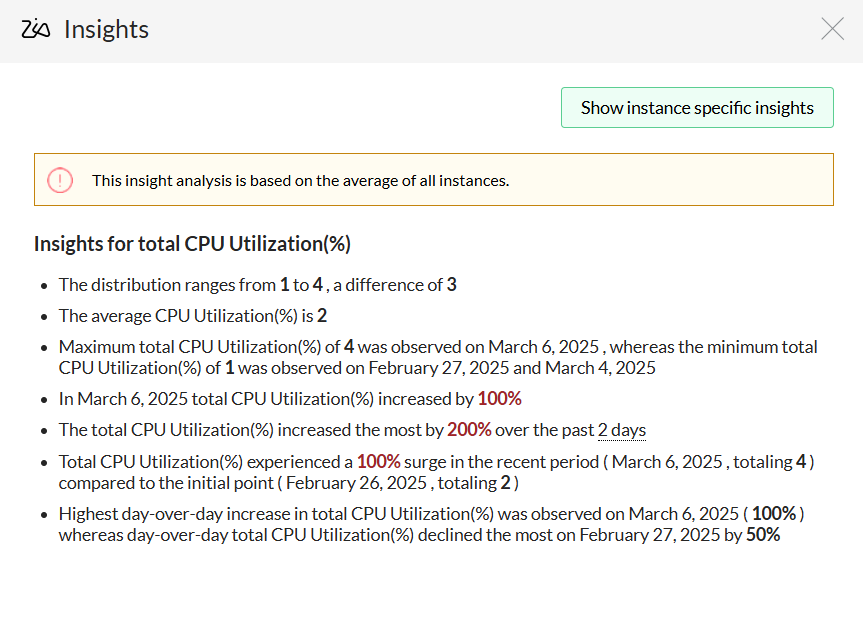
Understanding Zia insights
Zia Insights offer a deeper understanding of the data presented in graphs, enabling admins to gain visibility into performance trends and system behavior.
Example: CPU Utilization Insights
When viewing the CPU Utilization graph for a device, Zia may provide insights such as:
- The average CPU utilization over a period.
- The highest and lowest recorded utilization values.
- Day-over-day percentage increases or decreases.
- Which instance (CPU core) contributes the most to total utilization.
- Significant spikes or drops and their impact.
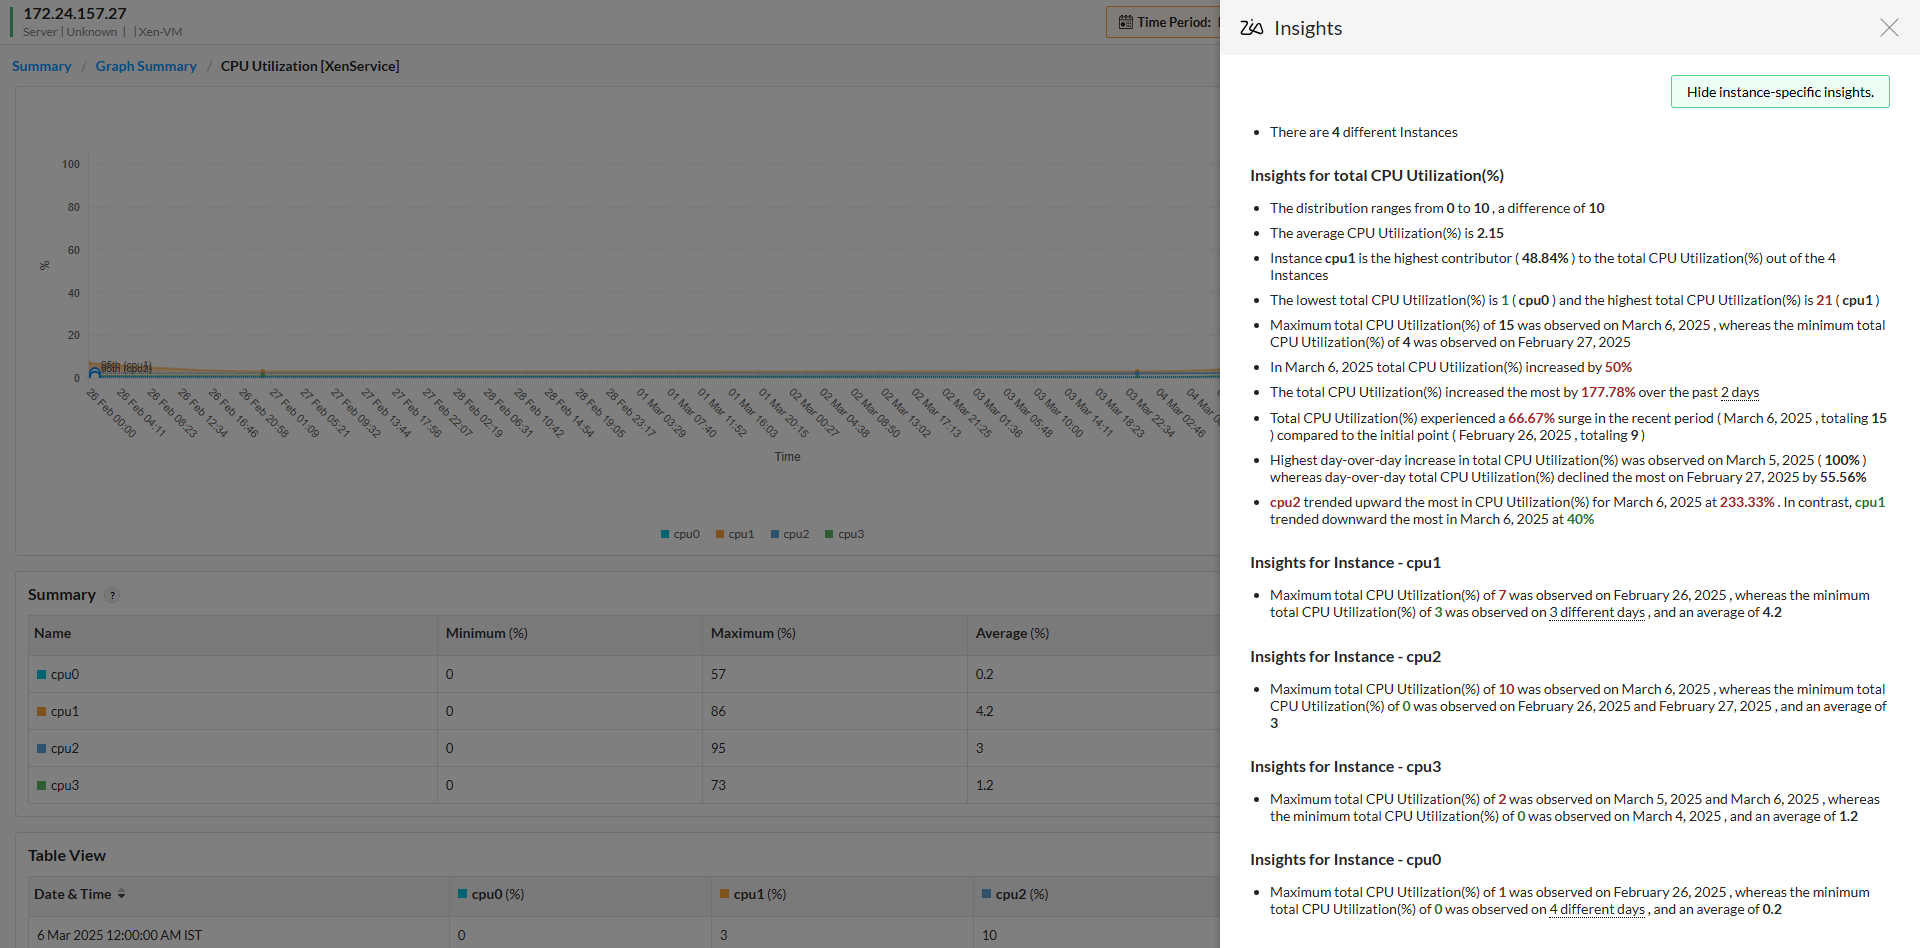
Instance-specific insights
For multi-instance metrics (e.g., multiple CPU cores, network interfaces, or storage volumes), Zia provides detailed insights for each individual instance.
This breakdown helps users pinpoint which instance is contributing the most to overall resource usage and identify any issues or inefficiencies within specific components.
Example: CPU utilization breakdown
When monitoring CPU utilization on a server with multiple cores, Zia Insights may reveal:
- Instance cpu1 is the highest contributor (e.g., 48.84% of total CPU utilization).
- Instance cpu0 has the lowest utilization, suggesting it is underutilized or idle.
- Maximum CPU utilization for cpu2 spiked to 10% on March 6, 2025, while the minimum was 0% on previous days.
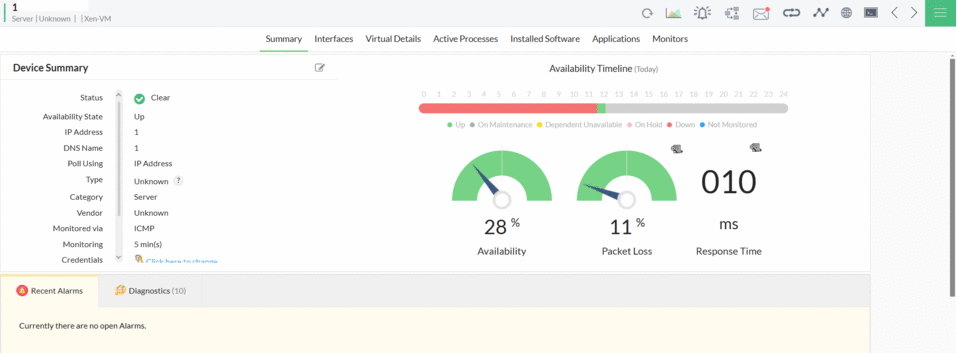
Zia Insights can be accessed for all numeric graphs from the Device Snapshot page in OpManager.
Whether you're monitoring CPU utilization, memory consumption, network traffic, or disk I/O, Zia provides detailed analytics to help you quickly interpret historical graphs.
Thank you for your feedback!